 Andrew@CANSLIM RESEARCH
The Bond Market’s Brutal Lesson for Wall Street
U.S. stocks sold off hard as the bond market stole the spotlight. Rising Treasury yields, firmer oil, and a weak Walmart print hit the major indexes at once. The Dow dropped more than 1%, with pressure spreading across growth and defensive names. The core problem is not just one bad day. Higher long-term rates are tightening financial conditions. They raise the discount rate on future earnings. This makes it harder for stocks to justify stretched valuations. The market is learning that this is not a temporary spike. It is a durable feature of the current landscape.
A Failed Rescue Fuels the $40 Trillion Punchline
Treasury Secretary Scott Bessent tried to calm the bond market with a bigger buyback toolkit. The reaction was limited and short-lived. The 30-year yield rebounded to 5.251%, while the 10-year rose to 4.704%. They essentially returned to pre-announcement levels. Total federal debt has crossed $40 trillion. The online crowd turned “$400 million versus $40 trillion” into the week’s biggest joke. They see the buyback as too small to matter. The ammunition was fired too soon. The bond market is forcing the Treasury’s head down and teaching it a lesson. The stock market is merely being dragged along and slowly bled out.
Walmart’s Warning Clashes With a Discount Retailer’s Surge
Walmart triggered consumer-spending panic. EPS of $0.81 beat expectations, but that included a one-time tariff refund. U.S. comparable-store sales rose just +2.6%. That was far below expectations and the weakest result in six years. The stock closed at 103.85, down 9.22%. The counterexample was discount retailer ROST. Q2 EPS came in at $2.66 versus $1.92 expected. Comparable-store sales jumped 10%. Shares rose after hours to 245.05. This split shows a two-tier consumer. One is struggling with higher prices. The other is actively seeking value. The online crowd is exhausted and angry, but not panicked. They are cycling between cursing market makers and cursing themselves.
Semiconductors Shine While Brokerage Stocks Bleed
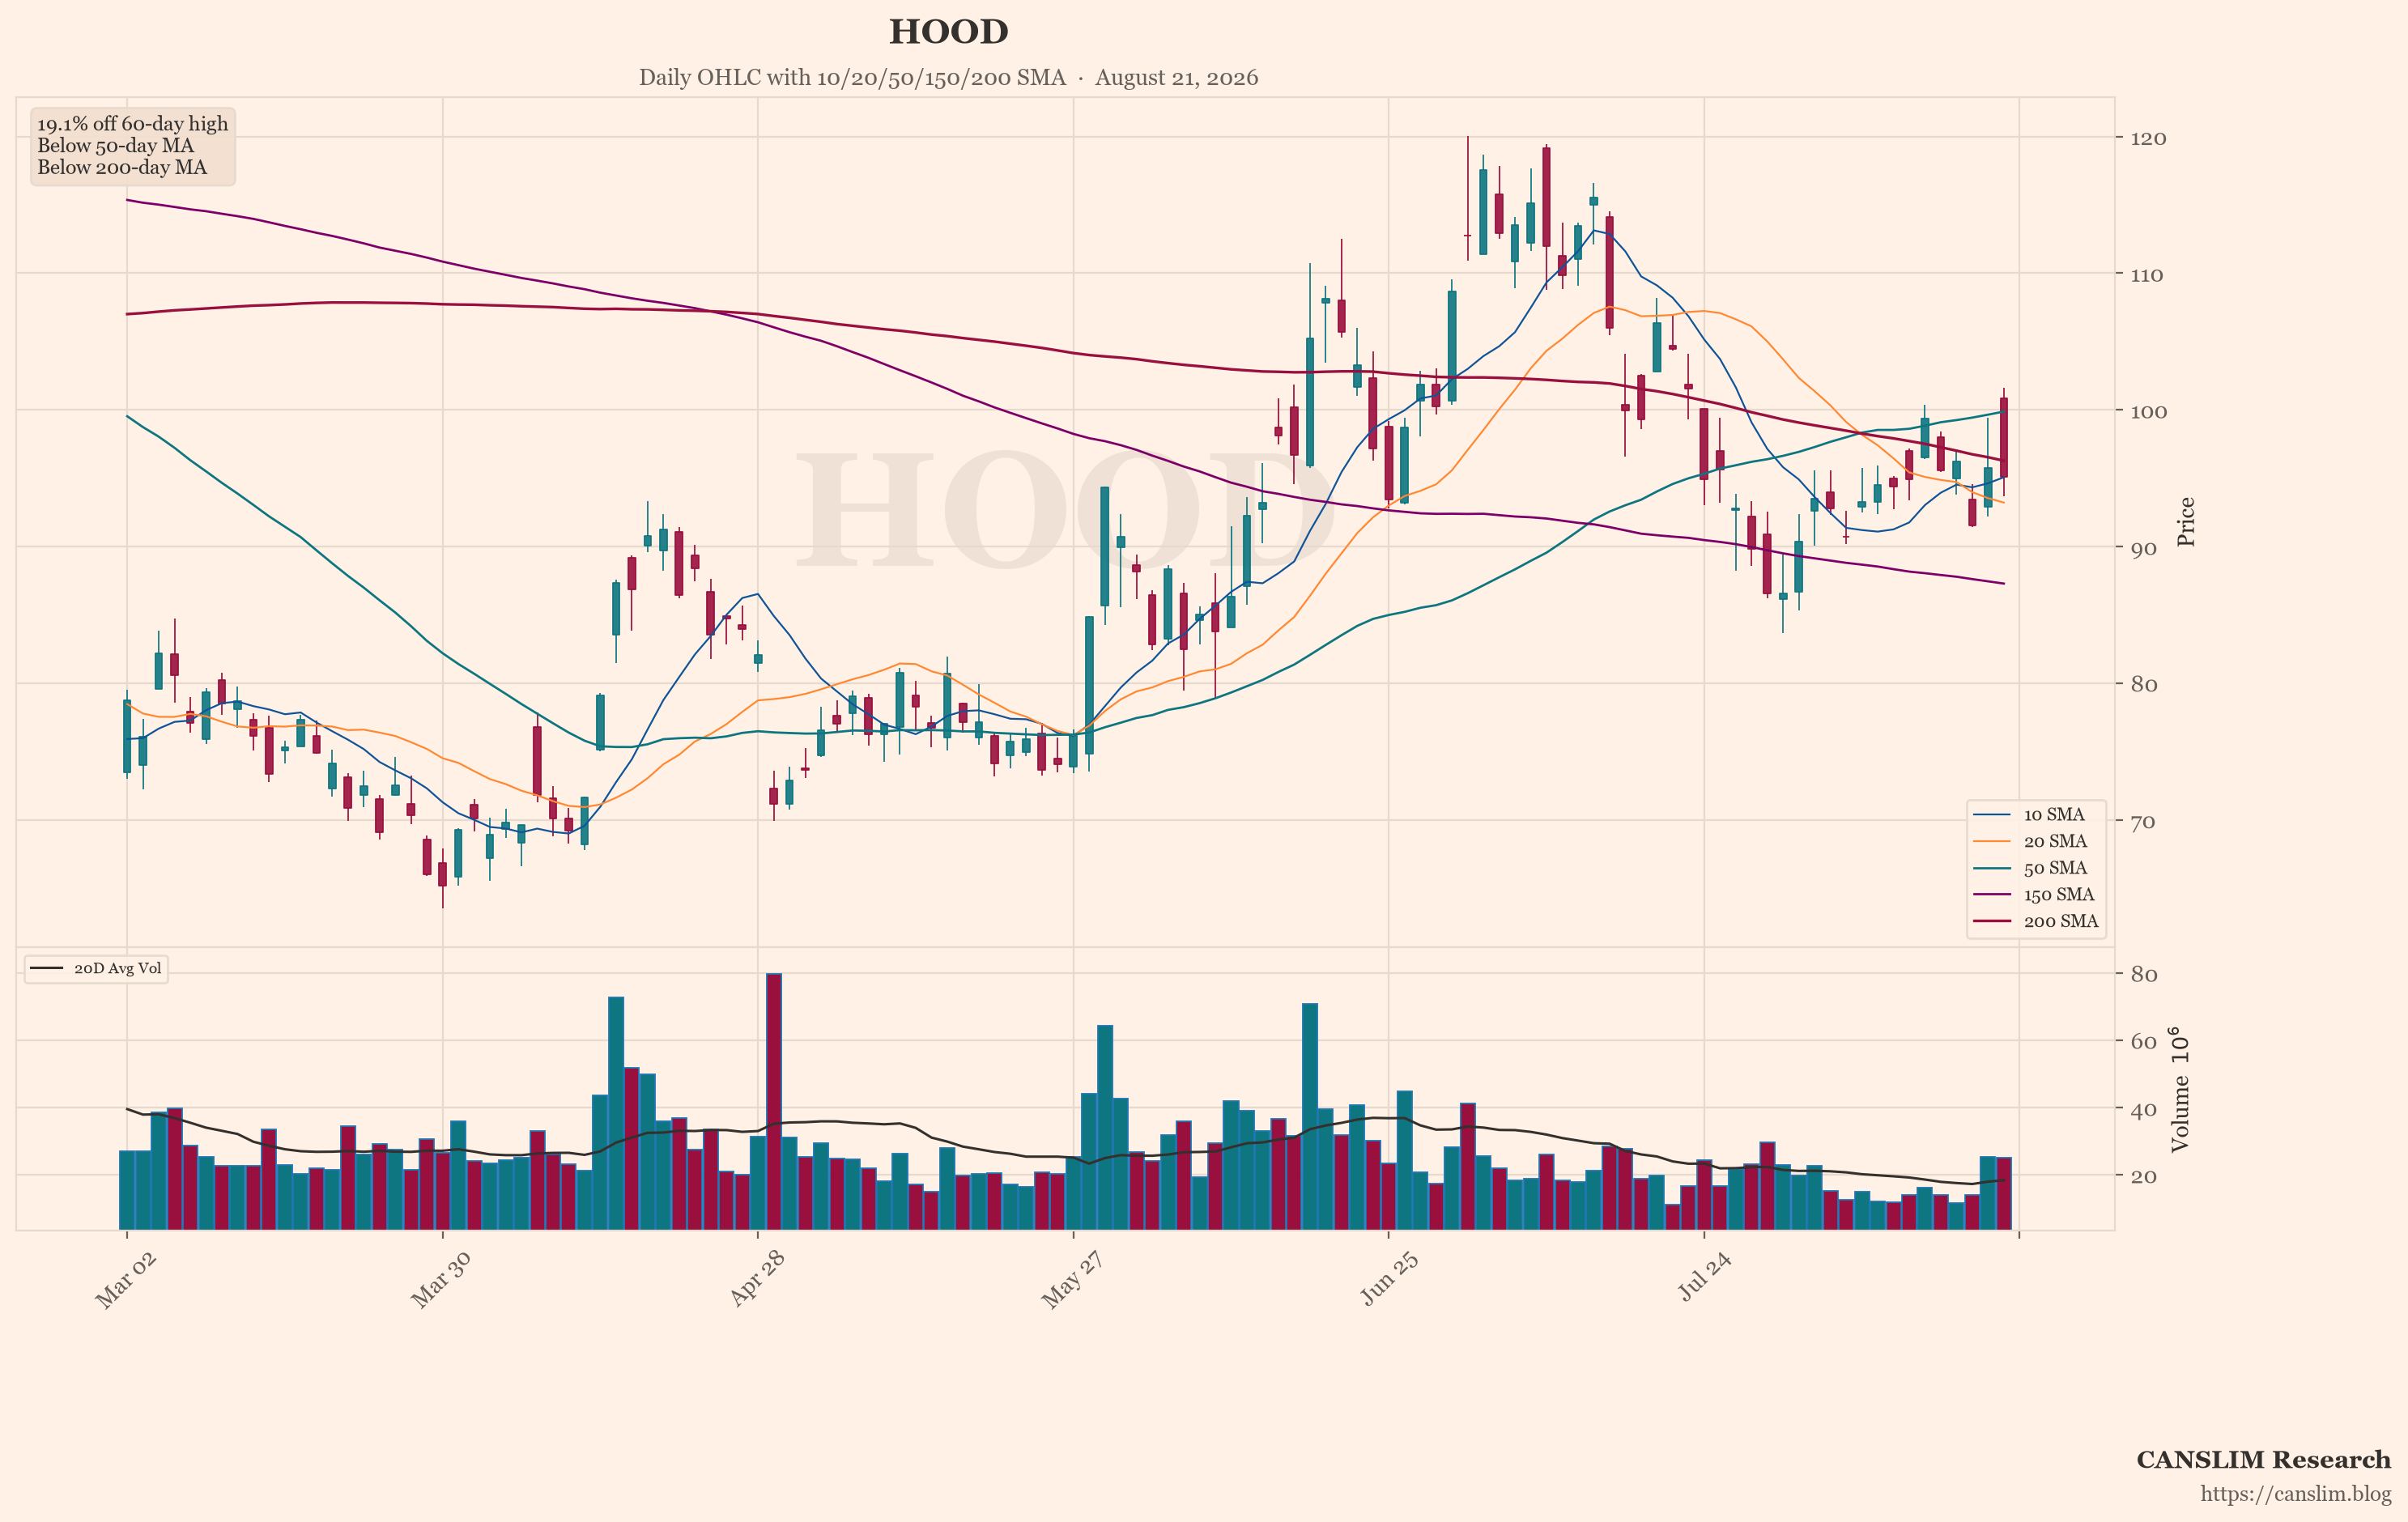
Memory and semiconductor stocks strengthened against the broader trend. MU closed at 971.43, up 3.66%. SNDK rose 2.39% to 1605.8. MRVL gained 5.17% after hours. Physical assets also rose. USO climbed 2.74%, and SLV gained 2.79%. Meanwhile, crypto and equities completely decoupled. Bitcoin briefly climbed above $72,000. IBIT gained 6.21%, and MSTR rose 7.80%. Brokerage stocks moved in the opposite direction. HOOD fell 0.68%, and SOFI dropped 2.85%. The featured chart for HOOD shows the weakest technical pattern. It is failing to participate in the risk-on moves. This divergence is a warning sign for momentum traders.
The Slowest Crash in History Tests Investor Patience
The labor market still looks steady. Weekly jobless claims came in at 206,000, near historic lows. This is not a recession panic. The fear level is approximately 35 to 40. That is fearful, but nowhere near extreme. VXX rose only 0.94%. The online crowd jokes that this is “the slowest crash in history.” The VIX is only at 16. It does not really start until it is above 25. The true panic signal is not in the indexes. It is at the individual level. There is an unusually high concentration of statements about liquidating portfolios and quitting gambling. The near-term risk is that bond weakness leaks into housing, small caps, and long-duration tech.
A Market Dragged Along by Forces Beyond Its Control
The dominant narrative is that the bond market is in control. The stock market is just a passenger. Higher oil prices add another inflation pressure. The $40 trillion debt backdrop makes investors sensitive to fiscal risk. Bessent publicly stated he did not understand why oil prices jumped. This triggered a tsunami of ridicule. The market is waiting to see if the Treasury steps up buybacks again. They are watching whether yields keep climbing. The pressure could spread further into rate-sensitive areas. For growth investors, patience is key. The leaders are holding up, but the tape is fragile. The online crowd is neither bullish nor willing to take large short positions. They are stuck in the middle, waiting for a clear signal. The slow bleed continues until the bond market blinks first.
Sources: market news brief & global social sentiment data. Updated 2026-08-21 06:00 HKT. For educational purposes only — not investment advice.
Discover more from CANSLIM Research
Subscribe to get the latest posts sent to your email.