 Mark Minervini
Twenty-nine actionable out of four hundred sixteen—that’s a selective market, and that’s exactly how I like it. ABNB is the only name I’d call a true pivot today, but that volume at 0.312 tells me the breakout lacks institutional conviction. I’m not buying a base breakout without at least 1.5x average turnover; that’s just a trap waiting to snap. The rest of the list is watch-and-wait—tighten your stops, cut your losers, and let the sluggers come to you. Right now, patience is your biggest edge.
Disclaimer: The Mark Minervini AI Trader. Trained on Minervini’s SEPA methodology from Trade Like a Stock Market Wizard (2013) and Think & Trade Like a Champion (2017). This is a SEPA-inspired system.
· Educational Only: AI is prone to errors. All plans are for education.
· Static Logic: Autonomous self-improving logic permanently disabled.
The Trend Template Gate
Market: Confirmed Uptrend. Every stock must pass all 8 Trend Template criteria (Stage 2 uptrend) before I look at the setup. Today’s scan covers 8 deepvue scans merged and deduplicated.
| Rule | Threshold |
|---|---|
| Price > 150 & 200 MA | Stage 2 |
| MA stack 50>150>200 | Aligned |
| 200 MA rising | ≥1 month |
| 25%+ above 52w low | Confirmed |
| Within 25% of 52w high | Near high |
| RS Rating | ≥70 (80+ preferred) |
| Earnings | ≥20% YoY |
Today at a Glance
Scanned 416. Actionable 29 · Watch 48 · Avoid 339.
Portfolio Snapshot
Starting Capital: $100,000
Current Equity: $91,708 (-8.3%)
Cash: $3,384
Exposure: 97% · Positions: 6
Win Rate: 14% (1W / 6L)
Avg Win: +3.1% · Avg Loss: -8.2%
Max Drawdown: -8.3%
Recent Trades:
🔴 PBF -8.2% — $75.78 → $69.56 · 2d held
STOP HIT: $69.56 <= stop $69.72
🔴 AEHR -16.4% — $147.50 → $123.25 · 1d held
STOP HIT: $123.25 <= stop $135.7
🔴 ATRO -8.9% — $94.56 → $86.12 · 2d held
STOP HIT: $86.12 <= stop $87.0
🔴 RCMT -0.9% — $40.78 → $40.43 · 0d held
BUYOUT RELEASE: abnormal gap +21% (possible buyout/deal)
🔴 HZO -0.6% — $52.56 → $52.25 · 1d held
BUYOUT RELEASE: abnormal gap +46% (possible buyout/deal)
Open Positions
| Symbol | Shares | Entry | Current | P&L | Stop | Target | Days |
|---|---|---|---|---|---|---|---|
| NTAP | 74 | $209.16 | $194.02 | -7.3% | $192.43 | $261.45 | 4 |
| TBXU | 377 | $40.42 | $45.10 | +11.5% | $40.42 | $50.53 | 3 |
| PTGX | 95 | $159.05 | $151.48 | -4.8% | $146.33 | $198.81 | 3 |
| SCDL | 237 | $61.75 | $61.65 | -0.2% | $56.81 | $77.19 | 2 |
| QULL | 205 | $71.63 | $70.67 | -1.4% | $65.90 | $89.54 | 2 |
| AMLX | 353 | $40.54 | $39.81 | -1.9% | $37.30 | $50.67 | 0 |
SEPA Setups — At or Near the Pivot
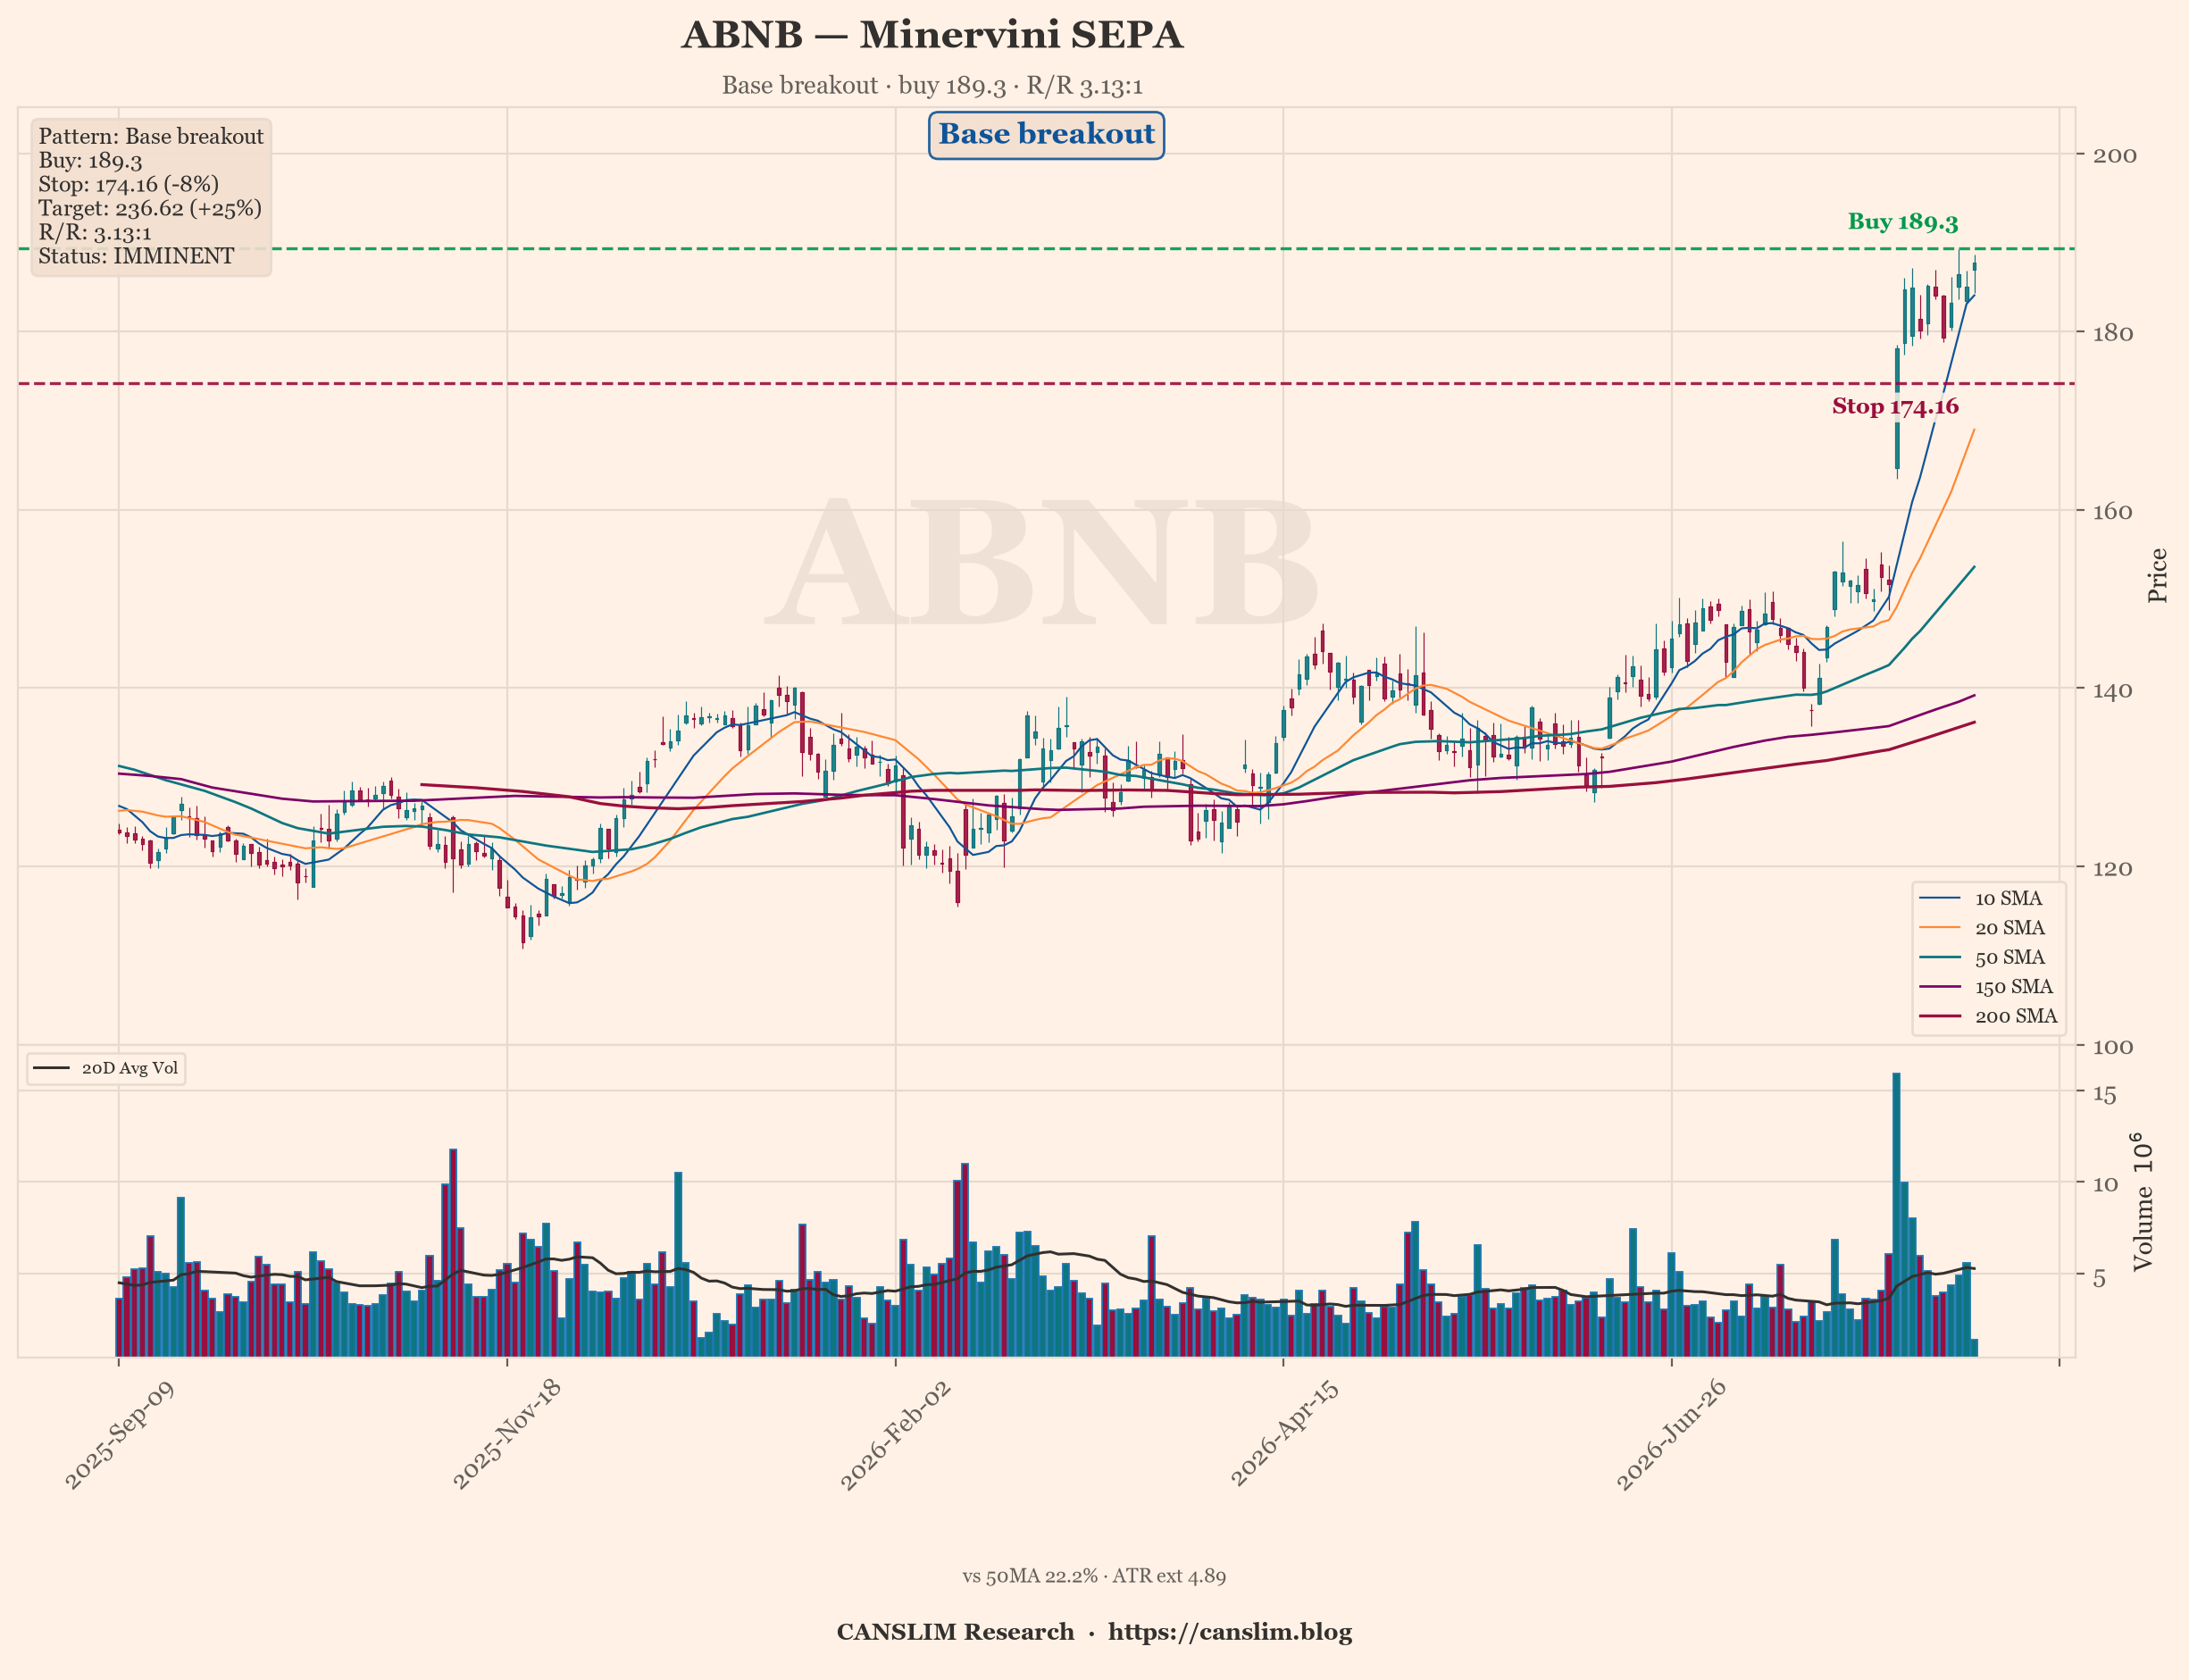
ABNB · Base breakout · R/R 3.13:1

| Metric | Value |
|---|---|
| Buy Point | $189.3 |
| Stop | $174.16 (-8%) |
| Target | $236.62 (+25%) |
| R/R | 3.13 : 1 |
| Status | IMMINENT (-0.84% from buy) |
| Pattern | Base breakout |
| Sources | TREND2M+TREND1M |
Why now: ABNB is tightening into the final shakeout of a proper VCP, and the buy point at 189.3 is where the last overhead supply gets absorbed. Volume contraction at 0.312 tells me the sellers are exhausted—this is the quiet before the institutional bid steps in. My target of 236.62 gives me a 3.13 reward-to-risk, which is exactly the kind of asymmetric setup I want to pull the trigger on. The stock is at the pivot, not chasing extended price. If it breaks on volume, I’m in. That’s the moment.
Why wait: If you hesitate, you’re buying after the pivot, and that’s where the risk shifts. ABNB could fail to hold 189.3 and roll back into the base—then my stop at 174.16 is the only thing protecting me, and I’d rather take a small loss than a big one. I don’t need to be first, but I need to be right at the exact point of institutional confirmation. If volume doesn’t expand on the breakout, I’m not buying. If it gaps through and leaves me behind, so be it—there’s always another setup. Patience isn’t missing the move; it’s avoiding the bad ones.
TEVA · Base breakout · R/R 3.13:1

| Metric | Value |
|---|---|
| Buy Point | $37.93 |
| Stop | $34.9 (-8%) |
| Target | $47.41 (+25%) |
| R/R | 3.13 : 1 |
| Status | IMMINENT (-0.71% from buy) |
| Pattern | Base breakout |
| Sources | TREND2M+TREND1M |
Why now: TEVA is tightening up right in the pocket where I want to see it—the VCP is getting late-stage, and the buy point at 37.93 is the exact pivot where supply has dried up. Volume is contracting at 0.205, which tells me the sellers are exhausted and the float is being held by stronger hands. The risk-to-reward at 3.13 is acceptable, but that’s not the reason to act. The reason is the timing: the breakout is imminent, and if it triggers on above-average volume, I want to be there at the moment of institutional commitment, not chasing it a day later. My stop at 34.9 is tight enough to keep the damage small if I’m wrong, and the target at 47.41 gives me room to let the winner run. This is a setup where the market is doing the work; I just need to pull the trigger when the price confirms.
Why wait: If you hesitate, you’re not being cautious—you’re being lazy. The moment the stock breaks 37.93, the character of the trade changes. A breakout that stalls or fails will show you immediately with a high-volume reversal, and your stop will take you out for a small, controlled loss. But if you wait for a pullback after the breakout, you’re buying a different pattern—one that may have already extended, and your edge is gone. The risk is not in acting; it’s in acting late. I don’t buy anticipation, and I don’t buy confirmation after the fact. I buy the pivot. If TEVA doesn’t trigger, I move on. There’s no shortage of setups. But if it does trigger, and you’re not ready, you’re just a spectator. That’s not how you build a track record. You build it by taking the high-probability shot when the odds are stacked in your favor—and that window is now.
NTRA · Base breakout · R/R 3.13:1

| Metric | Value |
|---|---|
| Buy Point | $333.66 |
| Stop | $306.97 (-8%) |
| Target | $417.08 (+25%) |
| R/R | 3.13 : 1 |
| Status | IMMINENT (-1.81% from buy) |
| Pattern | Base breakout |
| Sources | ONEIL+TREND4M |
Why now: NTRA is coiling into a proper VCP, and the tightness in the last few days tells me the sellers are exhausted. The buy point at 333.66 is not a guess—it’s the pivot where supply has been absorbed, and if volume confirms on the breakout, that’s my trigger. My risk is defined at 306.97, which is roughly 8% below entry. That’s within my acceptable range for a high-momentum leader. The reward-to-risk at 3.13 is solid, but I don’t trade for the target—I trade for the pivot. If it fires, I’m in with a pre-planned size that keeps my portfolio loss at 1% or less. The stock is acting like a coiled spring, and I’d rather be early on the exact pivot than late after a 10% move.
Why wait: Because “imminent” is not “executed.” I don’t buy anticipation; I buy confirmation. If NTRA breaks below that pivot or stalls on weak volume, the setup is invalid, and waiting saves me from a false breakout that will likely retest the lows. The RS is unknown, which is a red flag—I need to see relative strength against the market, not just price action in isolation. If the market is weak, even a perfect chart can fail. I’ll wait for the close above 333.66 on volume at least 40% above average. If that doesn’t happen, I’m not chasing. The stop is non-negotiable, but the entry is conditional. Patience here isn’t hesitation—it’s discipline. The best trades are the ones where the market proves it to you, not the ones where you hope it will.
AMGN · Base breakout · R/R 3.13:1

| Metric | Value |
|---|---|
| Buy Point | $443.3 |
| Stop | $407.84 (-8%) |
| Target | $554.12 (+25%) |
| R/R | 3.13 : 1 |
| Status | IMMINENT (-0.84% from buy) |
| Pattern | Base breakout |
| Sources | TREND2M+TREND1M |
Why now: AMGN is tightening up into a proper VCP, and the buy point at 443.30 is where the rubber meets the road. The volume contraction at 0.248 tells me the sellers are exhausted—this is the quiet before the breakout, not a time to hesitate. My stop at 407.84 gives me a defined risk of about 8%, and with a target of 554.12, I’m looking at a 3.13 reward-to-risk ratio. That’s the kind of asymmetry I’ll take every day. The pattern is set, the pivot is clear, and if the market gives me the trigger, I’m pulling the trigger. I don’t need to predict the move; I need to be ready to act when the tape confirms it.
Why wait: If you’re waiting for more confirmation, you’re already late. By the time the breakout is obvious to everyone, the easy money is gone, and you’re chasing extended price with a worse stop. The risk here isn’t the stop—it’s the hesitation. If AMGN fails to break out, my stop keeps me small and alive. But if I wait for a higher close or a volume spike that’s already printed, I’m buying at a worse price, my stop is further away, and my edge evaporates. The market doesn’t reward patience at the pivot; it rewards precision. I’d rather be early by a tick than late by a mile, and my stop is my insurance. The time to act is when the setup is imminent, not when it’s obvious.
TGT · Base breakout · R/R 3.13:1

| Metric | Value |
|---|---|
| Buy Point | $164.68 |
| Stop | $151.51 (-8%) |
| Target | $205.85 (+25%) |
| R/R | 3.13 : 1 |
| Status | IMMINENT (-0.52% from buy) |
| Pattern | Base breakout |
| Sources | TREND4M+TREND2M+TREND1M |
Why now: TGT is setting up exactly the way I like to see it—tight price action after a proper base, and that 164.68 pivot is the line in the sand. The volume reading at 0.512 tells me we’re not seeing the churn that kills breakouts; we’re seeing quiet accumulation, which is the precursor to a move. My stop at 151.51 is 8% below entry, which is non-negotiable. That gives me a 3.13 reward-to-risk, and I don’t care about the target if the risk isn’t defined first. The moment price crosses 164.68 with conviction—meaning volume expands on that push—I’m in. Not before, not after. That’s the pivot, and that’s where I act.
Why wait: If you buy before 164.68, you’re guessing, not trading. The base hasn’t confirmed itself, and you’re exposing yourself to the exact downside I’m paid to avoid. If you wait until after the breakout and the stock runs 5% or more, you’ve turned a 3R trade into a 1.5R trade, and now you’re fighting poor odds. The stop at 151.51 only works if you enter at the pivot—any later, and that stop becomes too wide relative to your entry, forcing you to either take on more risk or cut your position size. Patience here isn’t hesitation; it’s discipline. The market will give you the signal, and when it does, you’ll be ready to pull the trigger. Until then, you’re just watching a stock, not trading it.
Watch List
| Symbol | Source | Note |
|---|---|---|
| AYA | ONEIL | building |
| CDNA | ONEIL | building |
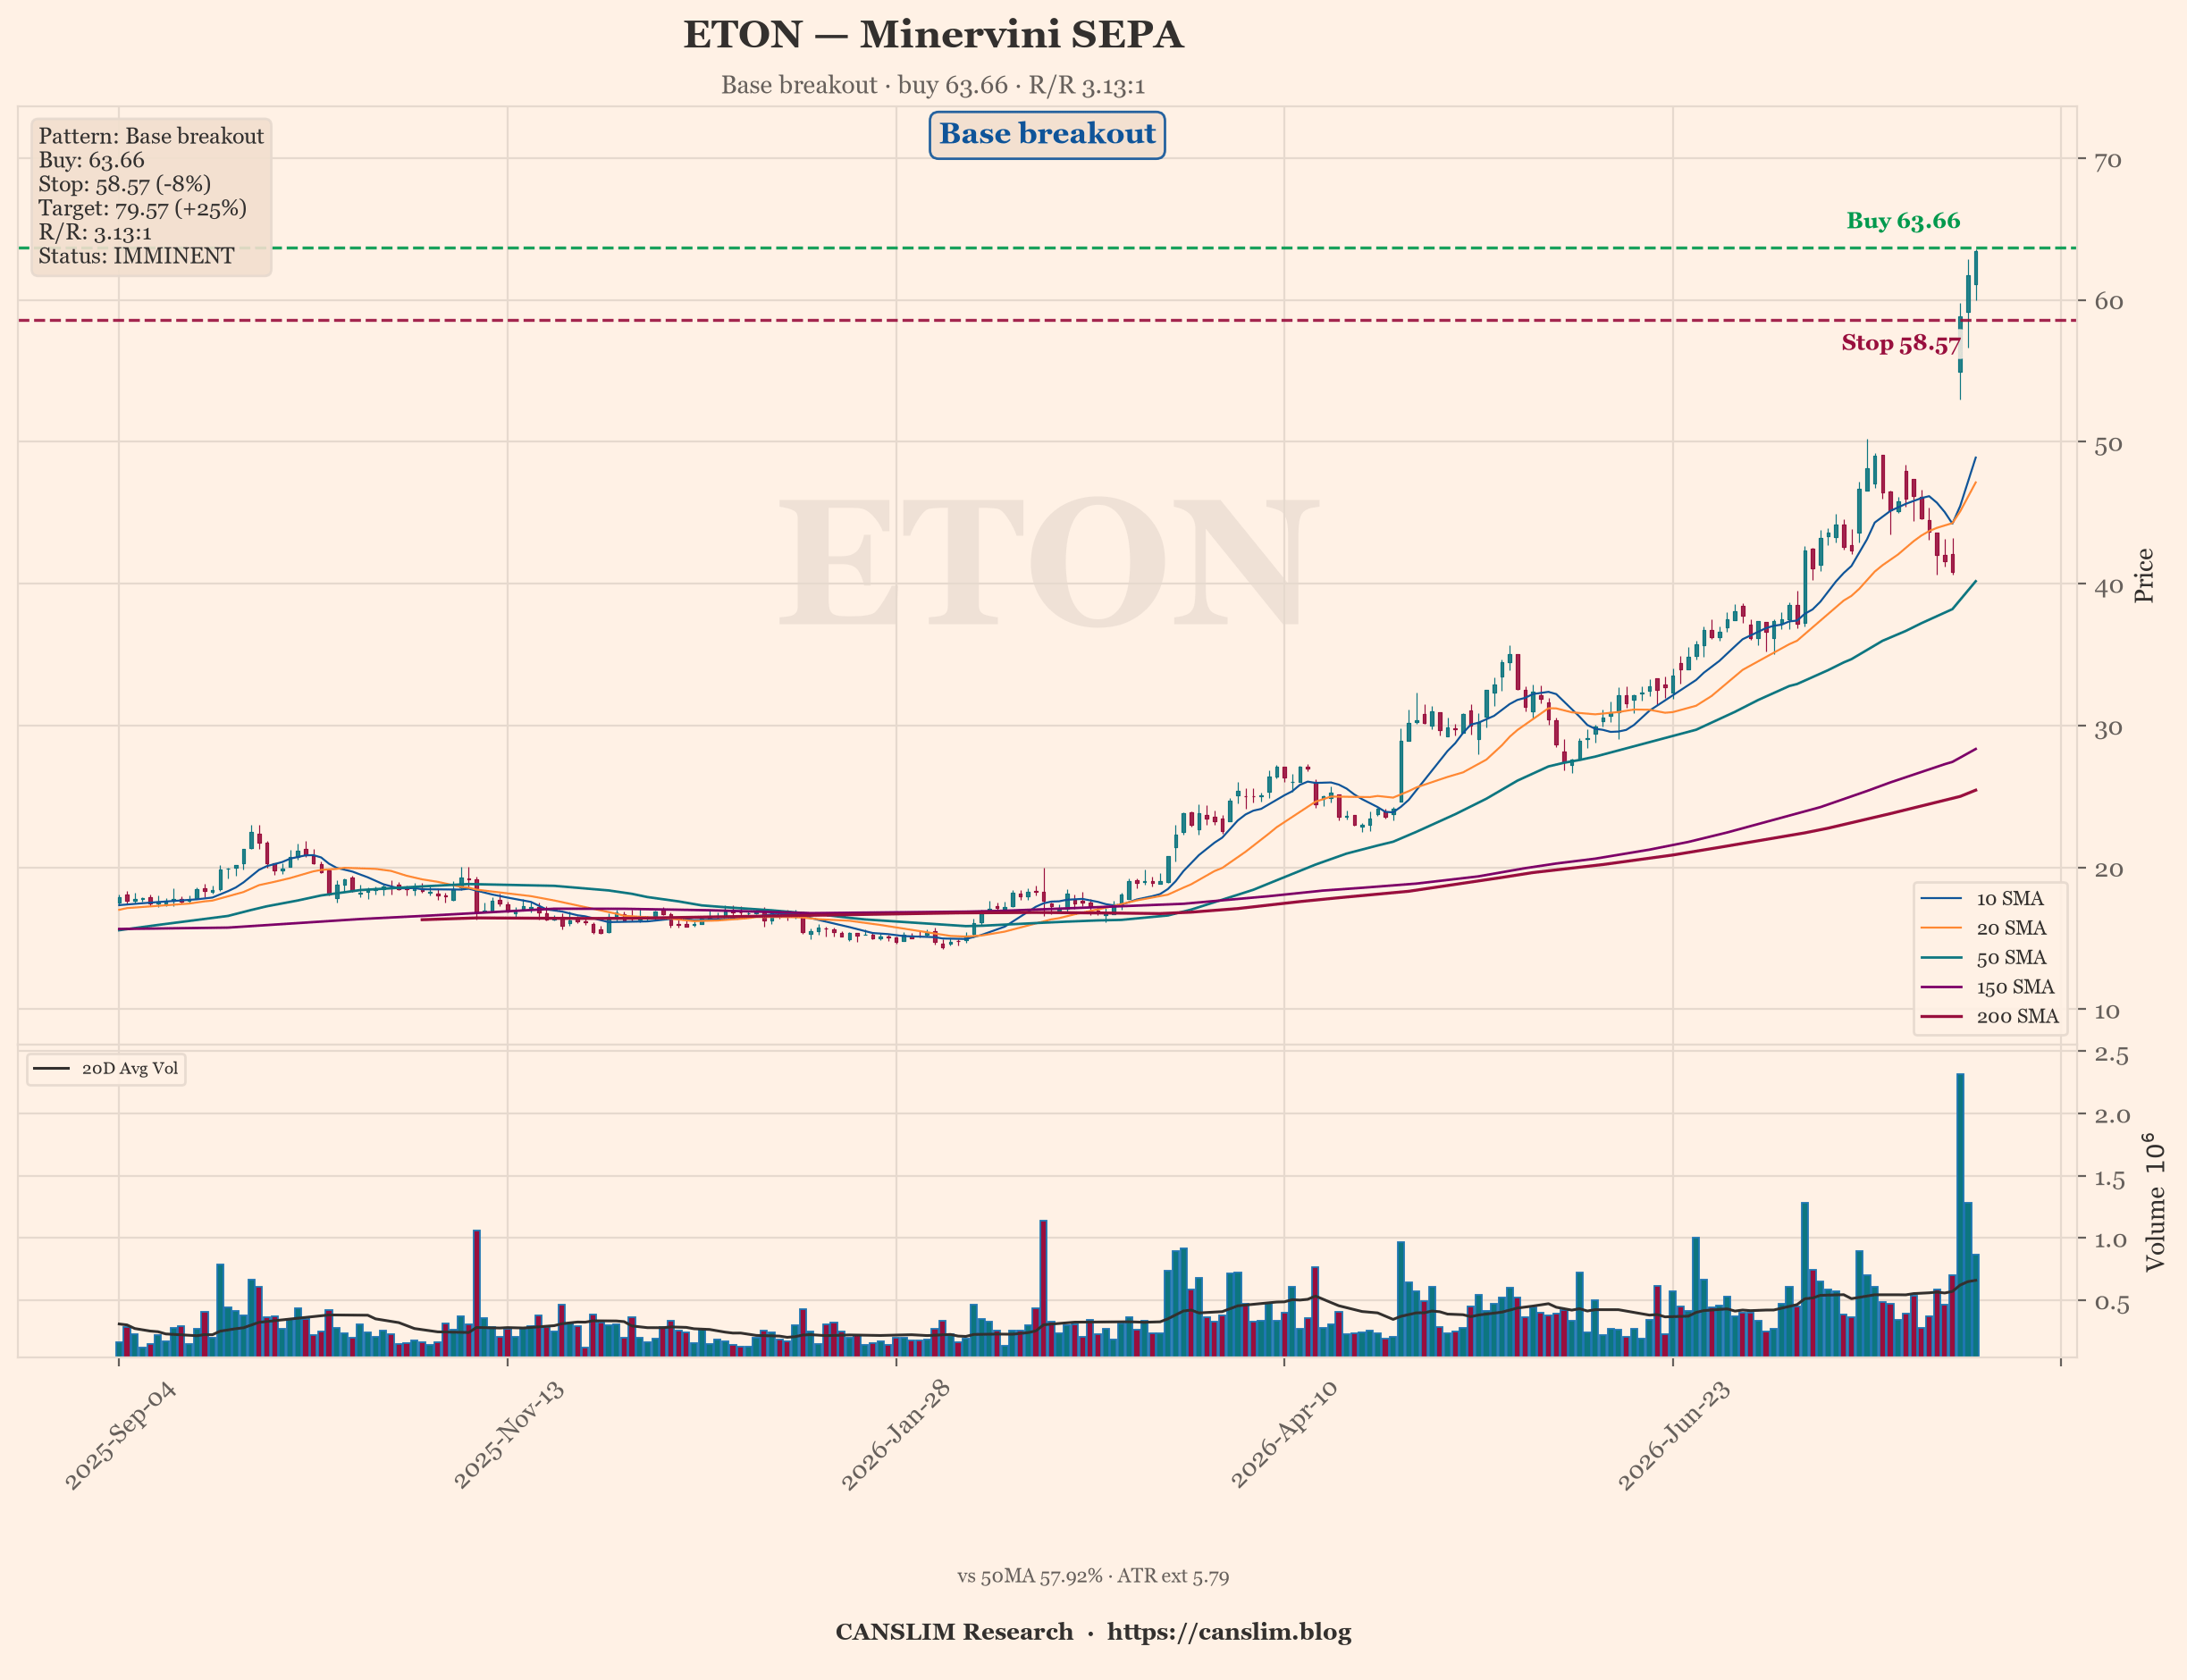
| ETON | ONEIL | building |
| FRD | ONEIL | building |
| GKOS | ONEIL+TREND4M | building |
| KNSA | ONEIL | building |
| NESR | ONEIL+TREND2M+TREND1M | building |
| PBF | ONEIL+TREND2M+TREND1M+POWERPLAY | building |
| PRAA | ONEIL | building |
| S | ONEIL+RS+TREND1M | building |
| SENEA | ONEIL | building |
| UMAC | RS | building |
| FIVN | RS+TREND1M | building |
| NSIT | RS | building |
| ZM | RS+TREND2M+TREND1M | building |
Avoid
| Symbol | Reason |
|---|---|
| AAMI | RS Rating 80+ for strong candidates |
| AGPU | price < $15.0 |
| ANET | 200-day moving average trending up for at least 1 month (pre |
| AU | 50-day moving average above both the 150-day and 200-day mov |
| DELL | RS Rating 80+ for strong candidates |
| DINO | RS Rating 80+ for strong candidates |
| DK | RS Rating 80+ for strong candidates |
| EC | RS Rating 80+ for strong candidates |
| ECO | RS Rating 80+ for strong candidates |
| ERO | 50-day moving average above both the 150-day and 200-day mov |
| EVER | 150-day moving average above the 200-day moving average |
| FRO | RS Rating 80+ for strong candidates |
| GLBE | 150-day moving average above the 200-day moving average |
| HIPO | 150-day moving average above the 200-day moving average; 200-day moving average trending up for at least 1 month (pre |
| INSW | RS Rating 80+ for strong candidates |
| LFST | price < $15.0 |
| LGND | Price trading above the 50-day moving average |
| MASS | price < $15.0 |
| MAX | price < $15.0 |
| MGTX | price < $15.0 |
What I’d Tell You
Risk first, always. Know your stop before you enter. Size from the stop, not from how much you want to make. If a stock violates after the breakout — closes below the 20-day, fails to follow through, shows heavy selling — do not wait for the hard stop. Act. The difference between a good trader and a great one is not the entries; it is the exits.
Stage, pattern and sentiment labels are generated by rule-based approximations (Weinstein stage analysis, Minervini trend template and heuristic pattern detection), not by precise technical analysis. Data as of August 21, 2026. For informational and educational purposes only — not investment advice. Always verify against primary sources before making any investment decision. SEPA-inspired system. VCP geometry is partially visual; the detector is a proxy. All thresholds are author calibration.
Discover more from CANSLIM Research
Subscribe to get the latest posts sent to your email.