 Eben@CANSLIM Research
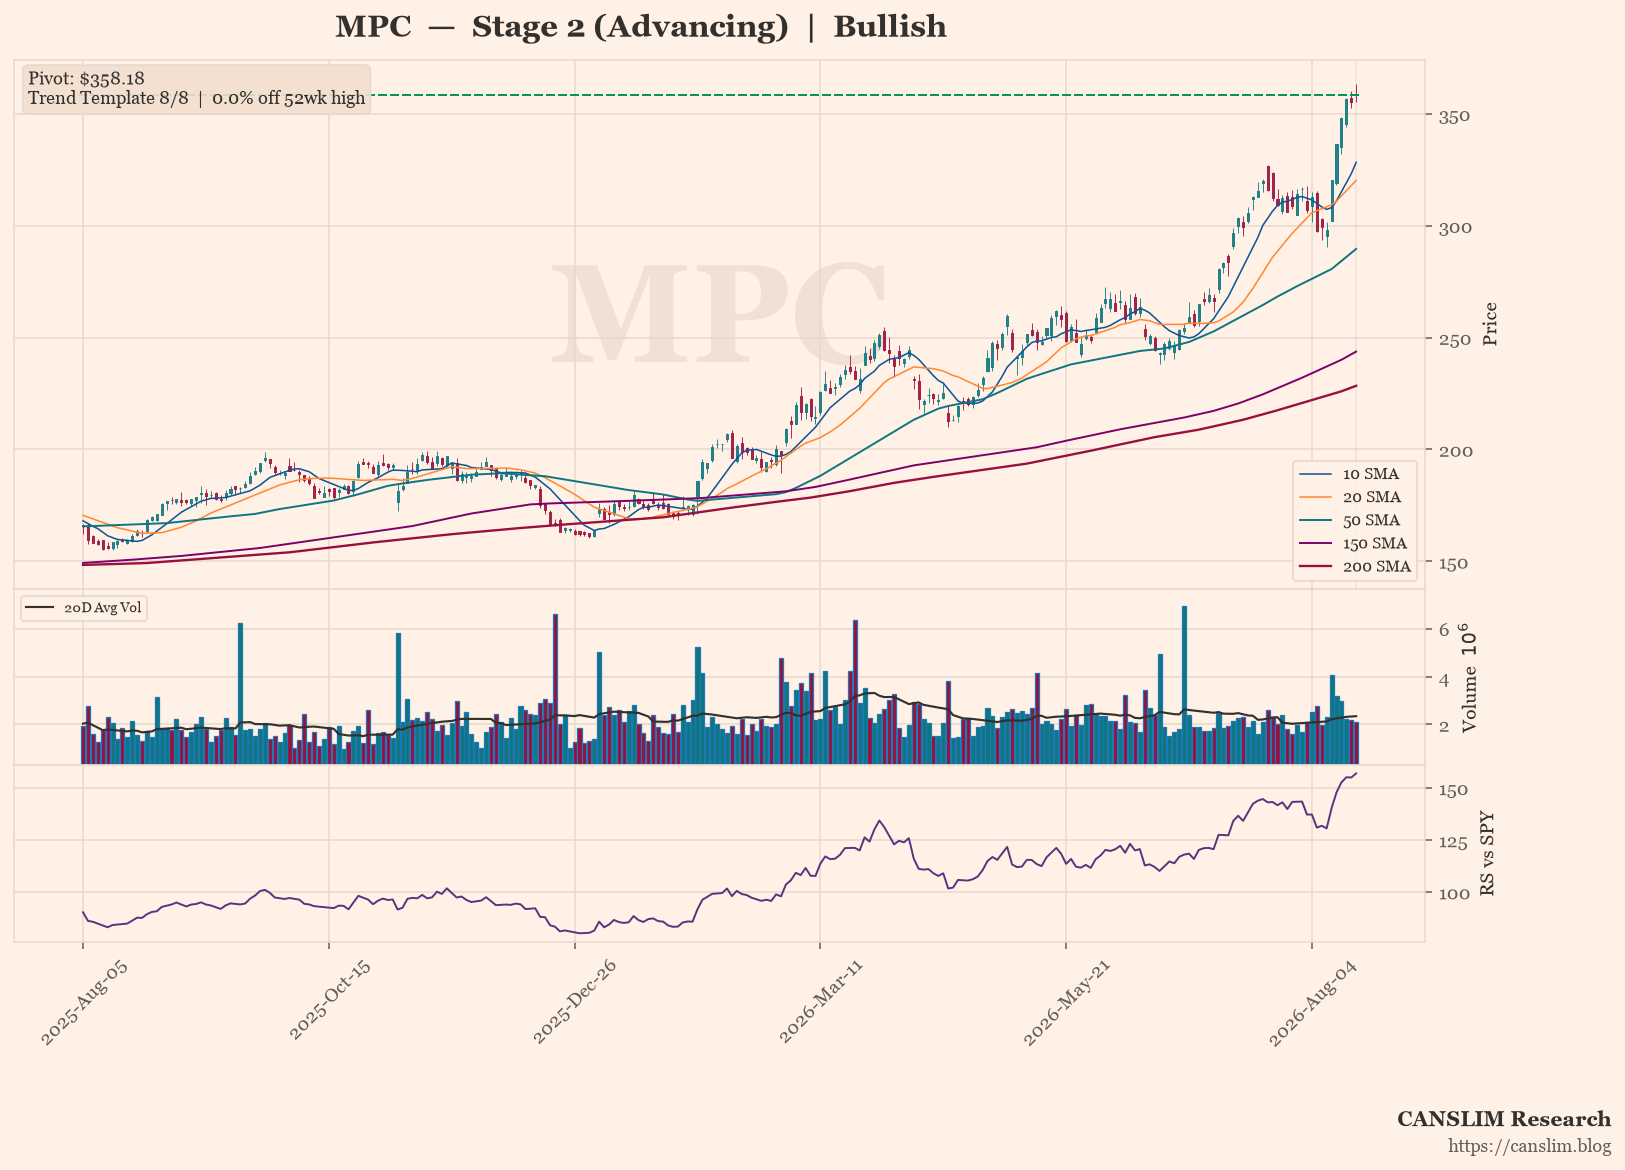
Marathon Petroleum (MPC) is trading at a fresh 52-week high of $358.18, firmly in a Stage 2 advancing trend. The stock holds above a rising 30-week moving average and has passed all eight technical trend-template checks, including price above key moving averages and a strong relative-strength line. With no base formation and a bullish sentiment score of 6, the market is focused on the stock’s momentum and its ability to sustain the uptrend without a pullback.
Technical Analysis
As of 2026-08-17 · Close $358.18
Stage Analysis
Stage 2 (Advancing) — Price holding above a rising 30-week MA — uptrend intact (30-week MA 6-week slope: 11.64%)
Detected Patterns — What the Market Is Watching
- No actionable pattern detected at this time.

Subscribe to continue reading
Subscribe to get access to the rest of this post and other subscriber-only content.