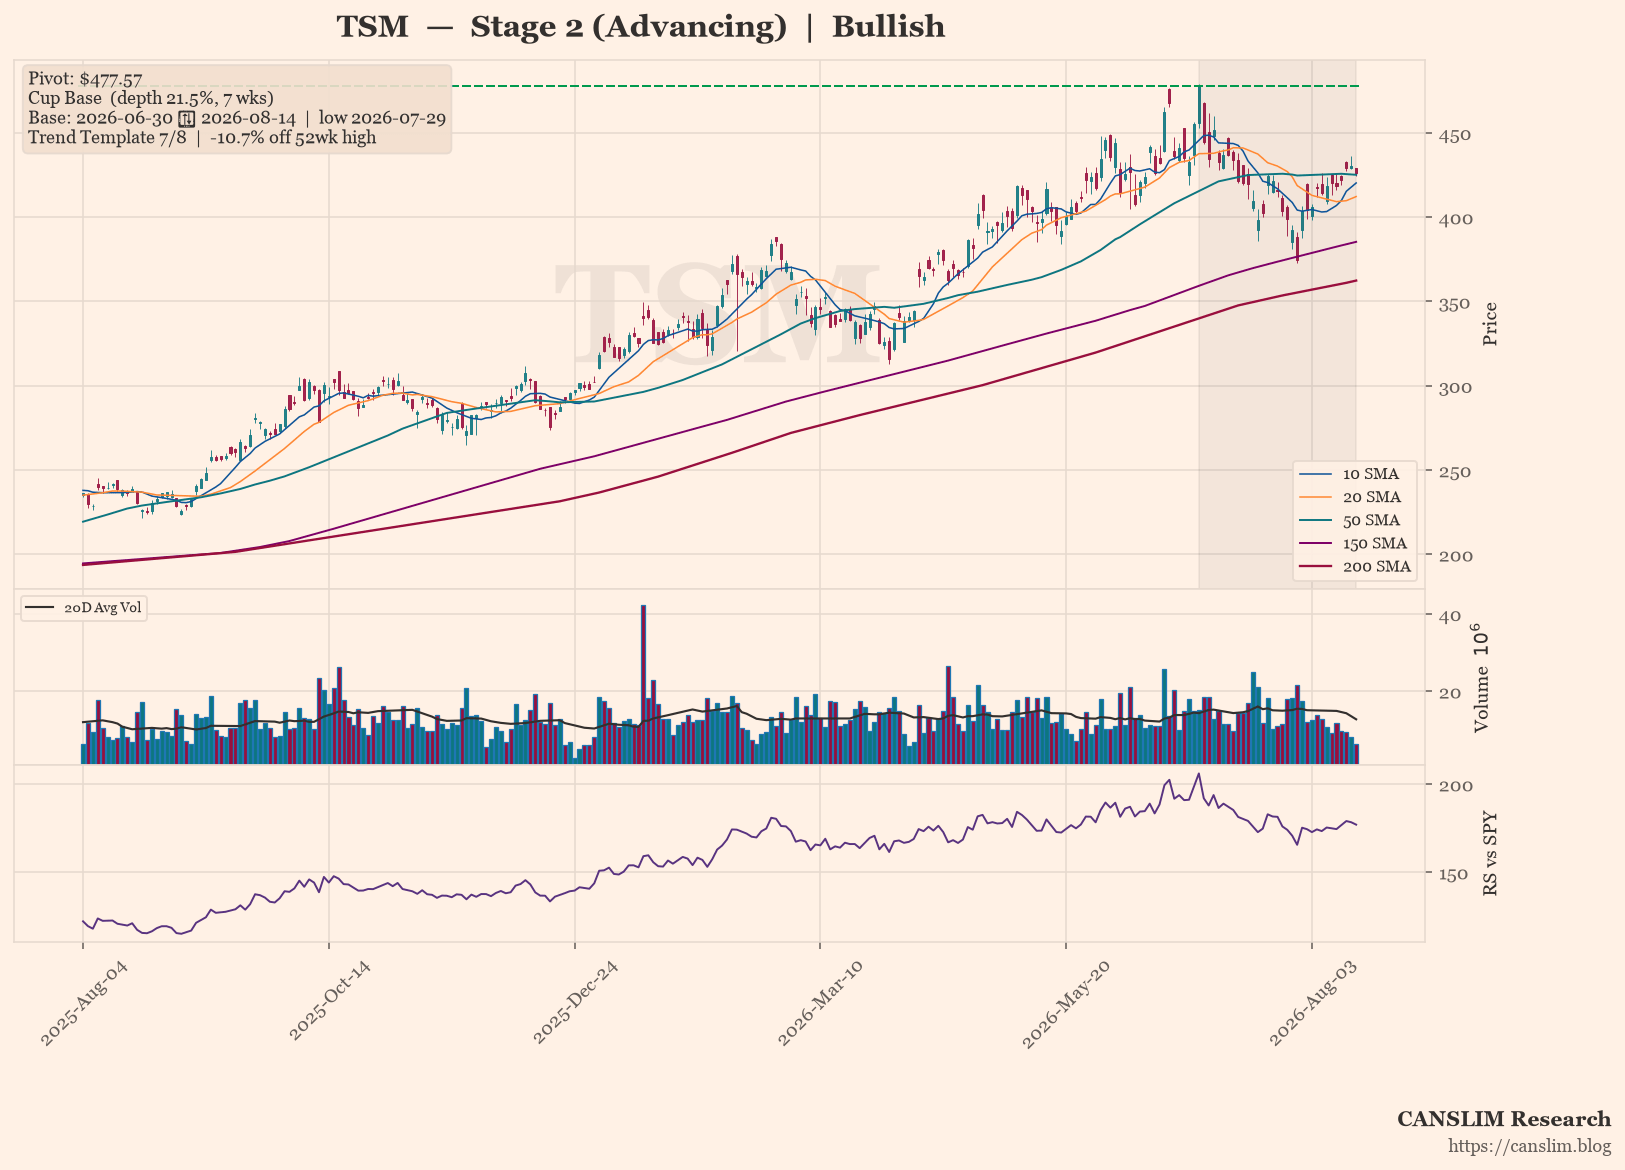
Taiwan Semiconductor (TSM) is consolidating in a 7-week Cup Base after a strong advance, with the stock holding above its rising 30-week moving average. The market is focused on the base’s 21.5% depth and the $477.57 pivot, which offers a potential breakout trigger. Overall sentiment is bullish, as the trend template passes 7 of 8 checks and the stock remains 89.6% above its 52-week low, though the relative strength line has not yet reached a 3-month high.
As of 2026-08-14 · Close $426.35
Stage 2 (Advancing) — Price holding above a rising 30-week MA — uptrend intact (30-week MA 6-week slope: 4.34%)
Continue Reading
This article is for pass holders.
Most Flexible
30-Day Pass$12.00One-time purchase · no auto-renewalBuy 30 DaysSave $24.00
365-Day Pass$120.00$144.00One-time purchase · no auto-renewalBuy 365 Days
30-Day Pass$12.00One-time purchase · no auto-renewalBuy 30 DaysSave $24.00
365-Day Pass$120.00
Already a pass holder? Sign in · Continue with Google