LTRX Forms Deep Base in Stage 3 Topping, Neutral Bias

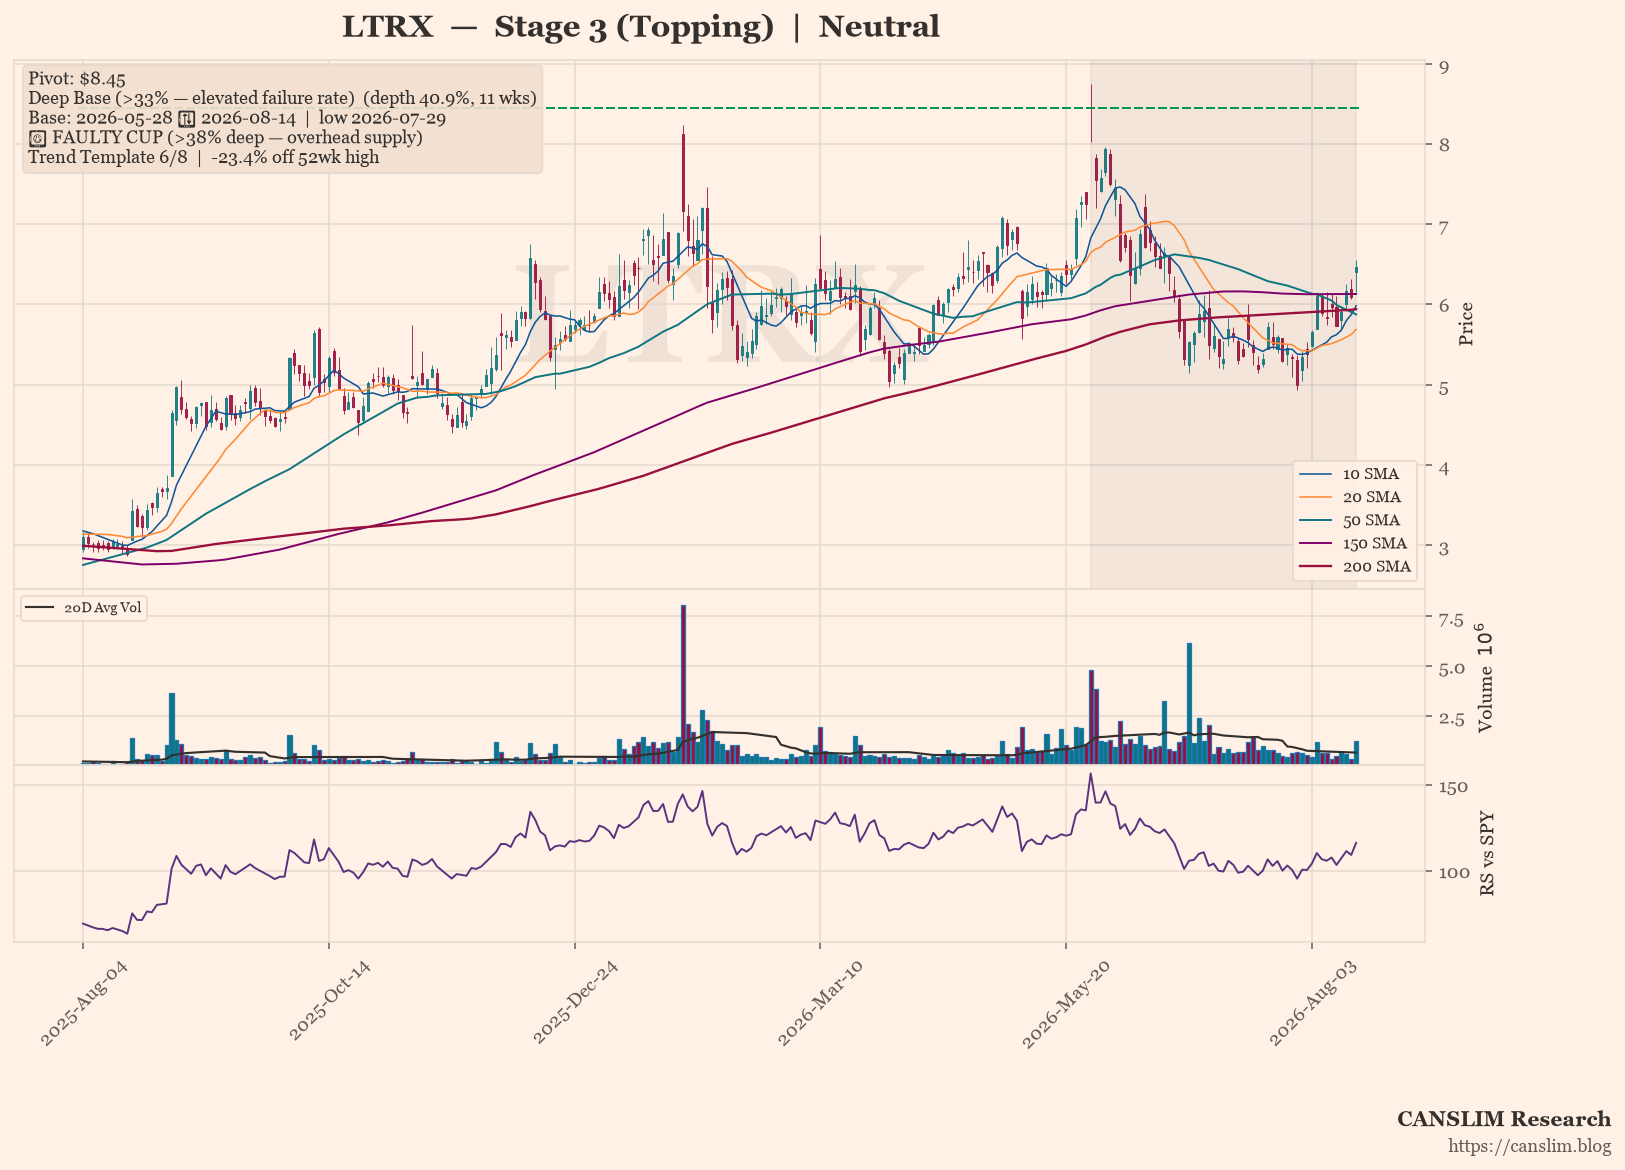
LTRX daily stock chart with 10, 20, 50, 150 and 200-day moving averages, volume and RS line versus SPY — CANSLIM Research

LTRX is consolidating in a Stage 3 topping pattern, with price churning around the 30-week moving average. The current base is a deep 40.9% correction over 11 weeks, which historically carries an elevated failure rate. With no VCP contraction or breakout trigger, the setup remains neutral and warrants a wait-and-see approach.

As of 2026-08-14 · Close $6.47

Stage 3 (Topping) — Price churning around the 30-week MA — topping consolidation (30-week MA 6-week slope: -1.26%)

⚠️ Faulty cup warning: the base is 40.9% deep (above the 38–40% threshold). A correction this deep leaves heavy overhead supply — trapped holders from higher prices are likely to sell into any rally, raising the failure rate of a breakout from this base.

About CANSLIM Research

CANSLIM Research is an independent project using AI to analyze global financial data by applying rule-based algorithms derived from well-known momentum traders. Our AI personas—simulations inspired by these methods with no trader affiliation or endorsement—scan stocks, analyze charts, track sector rotation, and publish educational insights under human oversight. Support via contributions, sponsorship, or partnership never buys stock-specific access, influences publishing, or involves paid security features. We are not a registered charity.

Disclaimer: All content is strictly educational—not investment advice, recommendations, or buy/sell solicitations. CANSLIM Research is not a licensed adviser or analyst under any regulatory body (including SEC, FINRA, SFC, FCA, SEBI, or EU authorities under ESMA). Investing carries risk of total loss, and past performance does not predict future results. Consult a licensed financial adviser before investing.