 Eben@CANSLIM Research
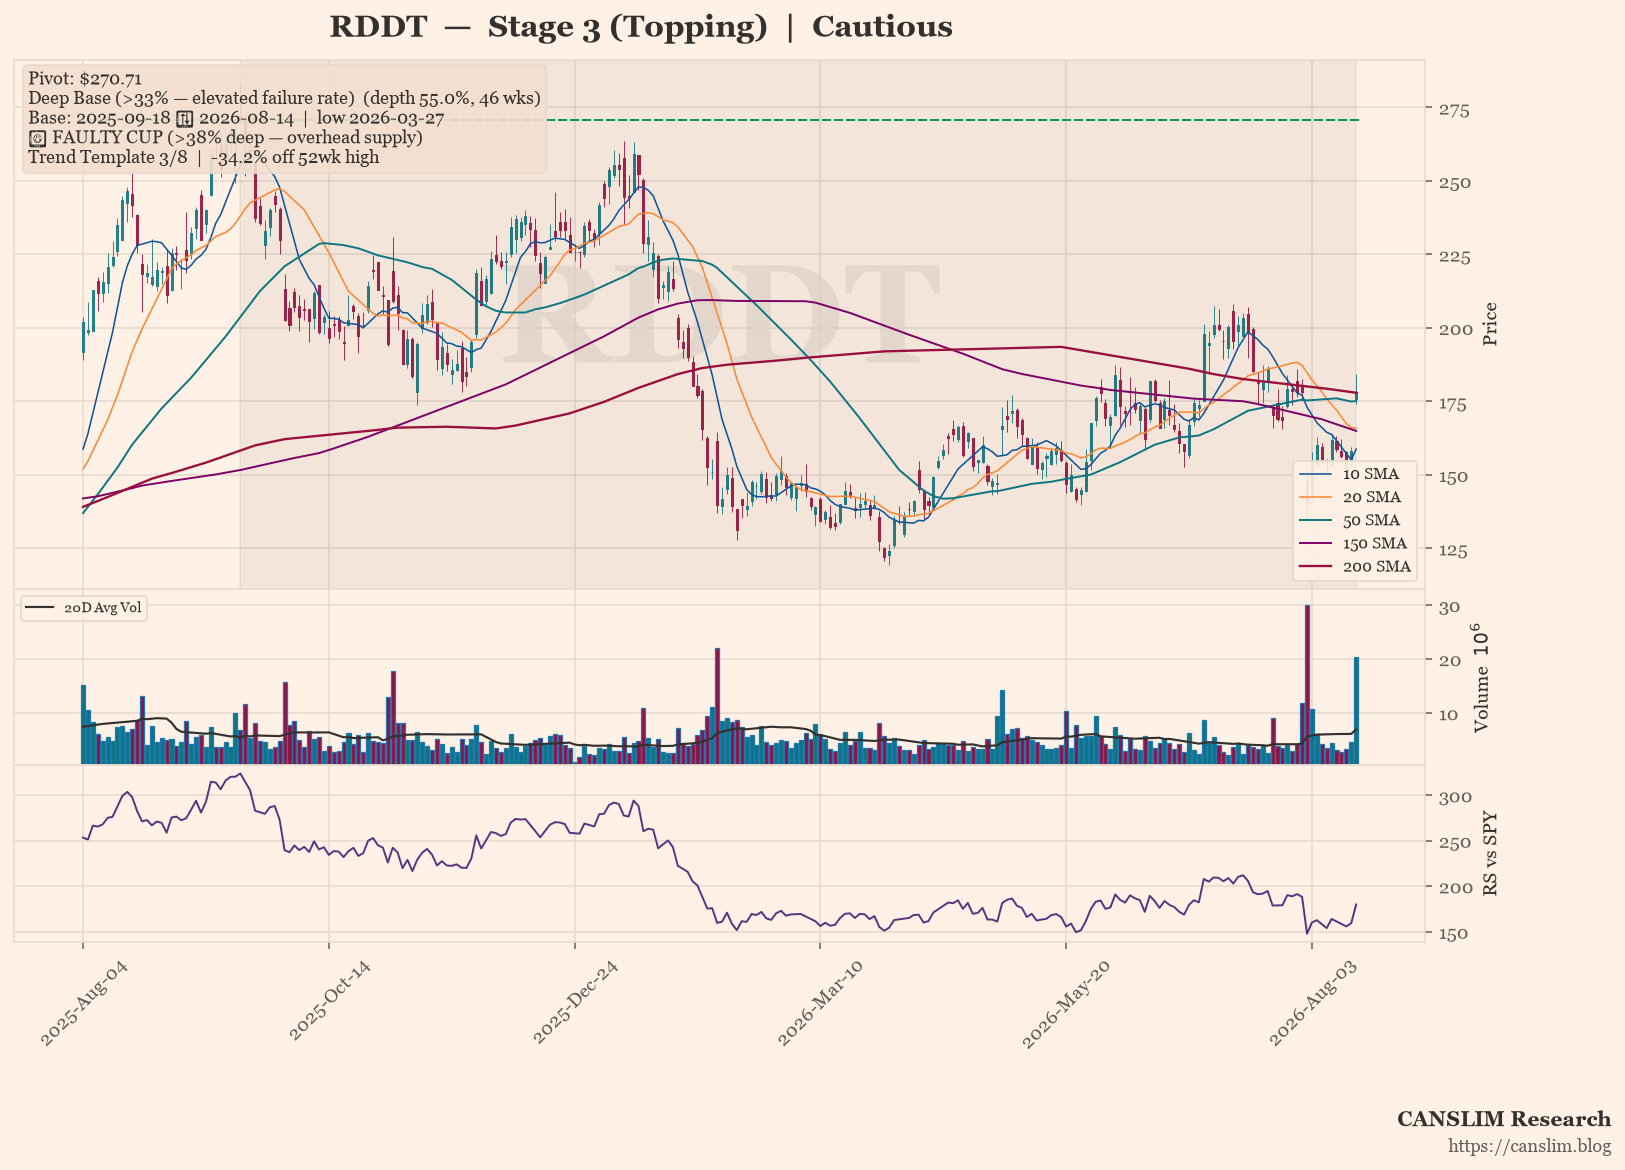
RDDT is exhibiting a Stage 3 topping pattern, with price churning around the 30-week moving average and a deteriorating technical backdrop. The stock is forming a deep, faulty base with a 55% depth, which historically carries an elevated failure rate, and the trend template has failed on key criteria including the 50/150/200-day MA alignment and distance from highs. Overall sentiment is cautious, with the market focused on the lack of a proper VCP contraction and the absence of a valid breakout, suggesting further downside risk.
Technical Analysis
As of 2026-08-14 · Close $178.09
Stage Analysis
Stage 3 (Topping) — Price churning around the 30-week MA — topping consolidation (30-week MA 6-week slope: -6.73%)
Detected Patterns — What the Market Is Watching
- Deep Base (>33% — elevated failure rate) — depth 55.0%, length 46 weeks, pivot $270.71. Base formed from 2025-09-18 (left-side high) to 2026-08-14, with the low of $121.84 set on 2026-03-27
⚠️ Faulty cup warning: the base is 55.0% deep (above the 38–40% threshold). A correction this deep leaves heavy overhead supply — trapped holders from higher prices are likely to sell into any rally, raising the failure rate of a breakout from this base.

Subscribe to continue reading
Become a paid subscriber to get access to the rest of this post and other exclusive content.