 Andrew@CANSLIM RESEARCH
The Opening Bell Rings With a Dilution Shock
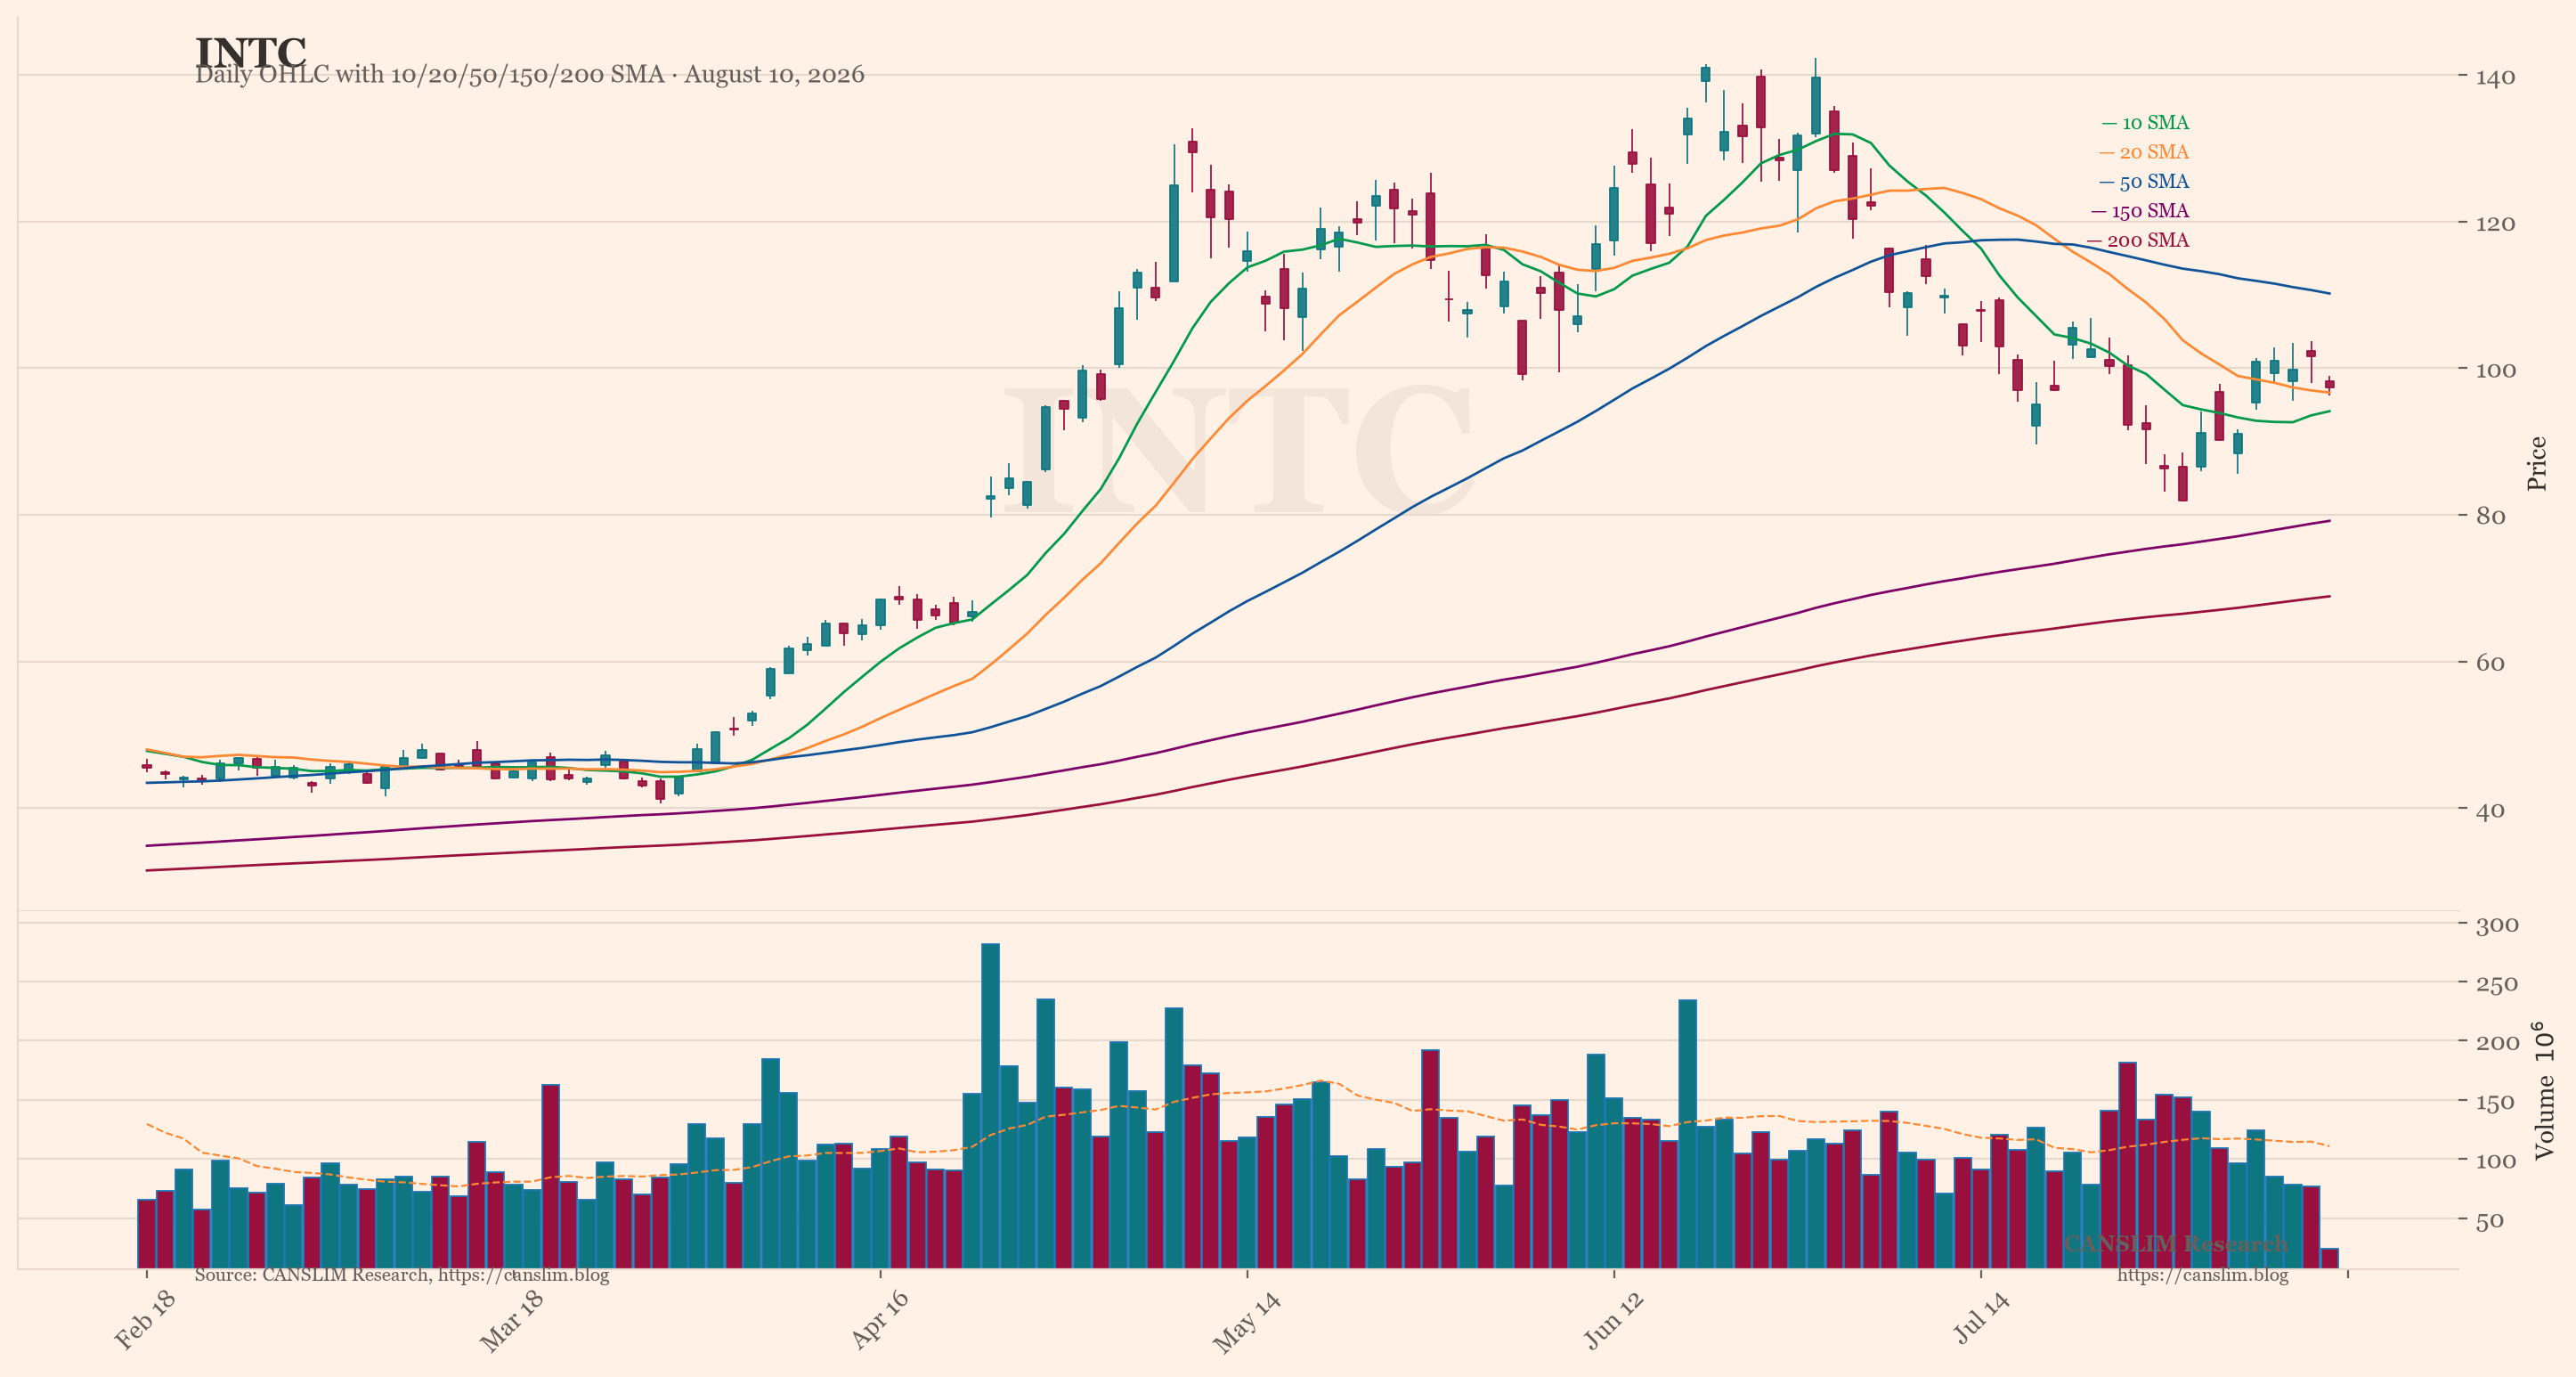
Intel’s $15 billion common stock offering hit the tape like a cold wave. The foundry and AI capex raise translates to roughly 150 million new shares, and the market punished the stock with a 3% premarket drop to near $96.40. The online crowd immediately linked this to a broader “dilution wave” spreading through tech. They pointed at Google’s bond issuance and neocloud capital raises as proof that the era of cheap money is over. This is not a panic. It is a repricing. The index grinds sideways, but underneath, capital is being redeployed with surgical precision. The featured chart for this analysis is INTC, and it currently shows the weakest technical pattern of any major name. That weakness is not an accident. It is the direct result of supply hitting a stock that already lacked demand.
The Memory Collapse Turns Into a Public Autopsy
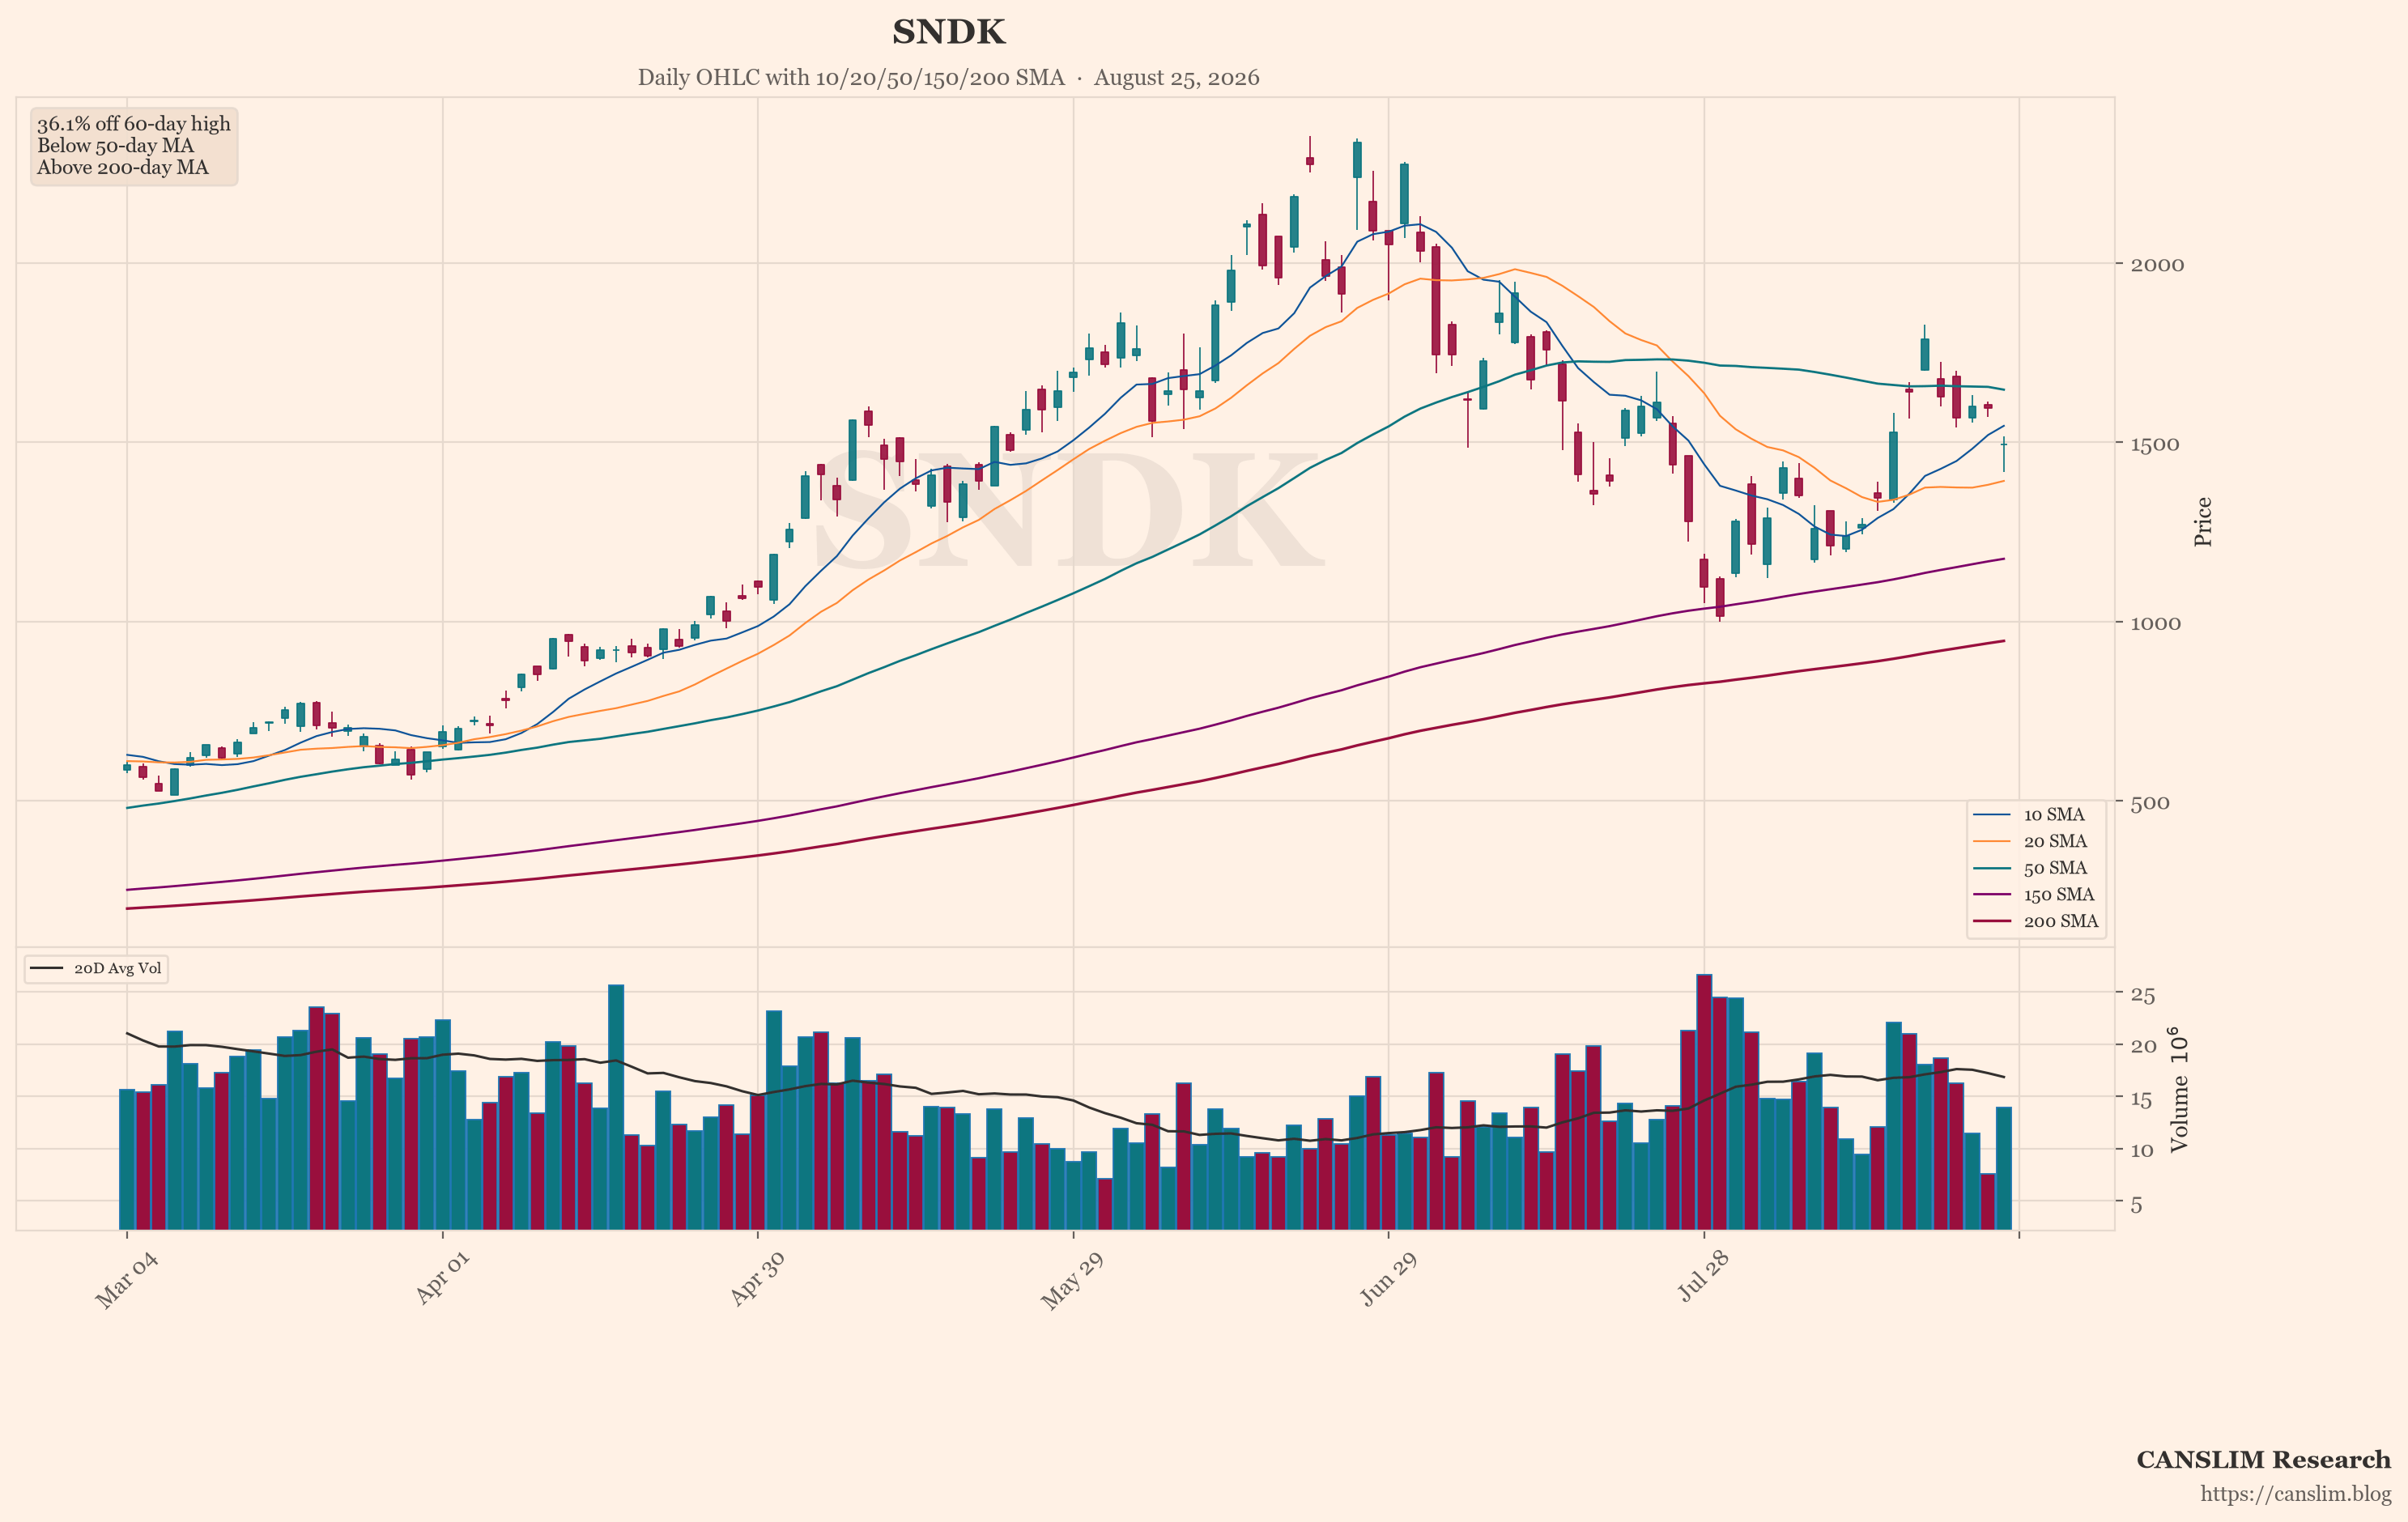
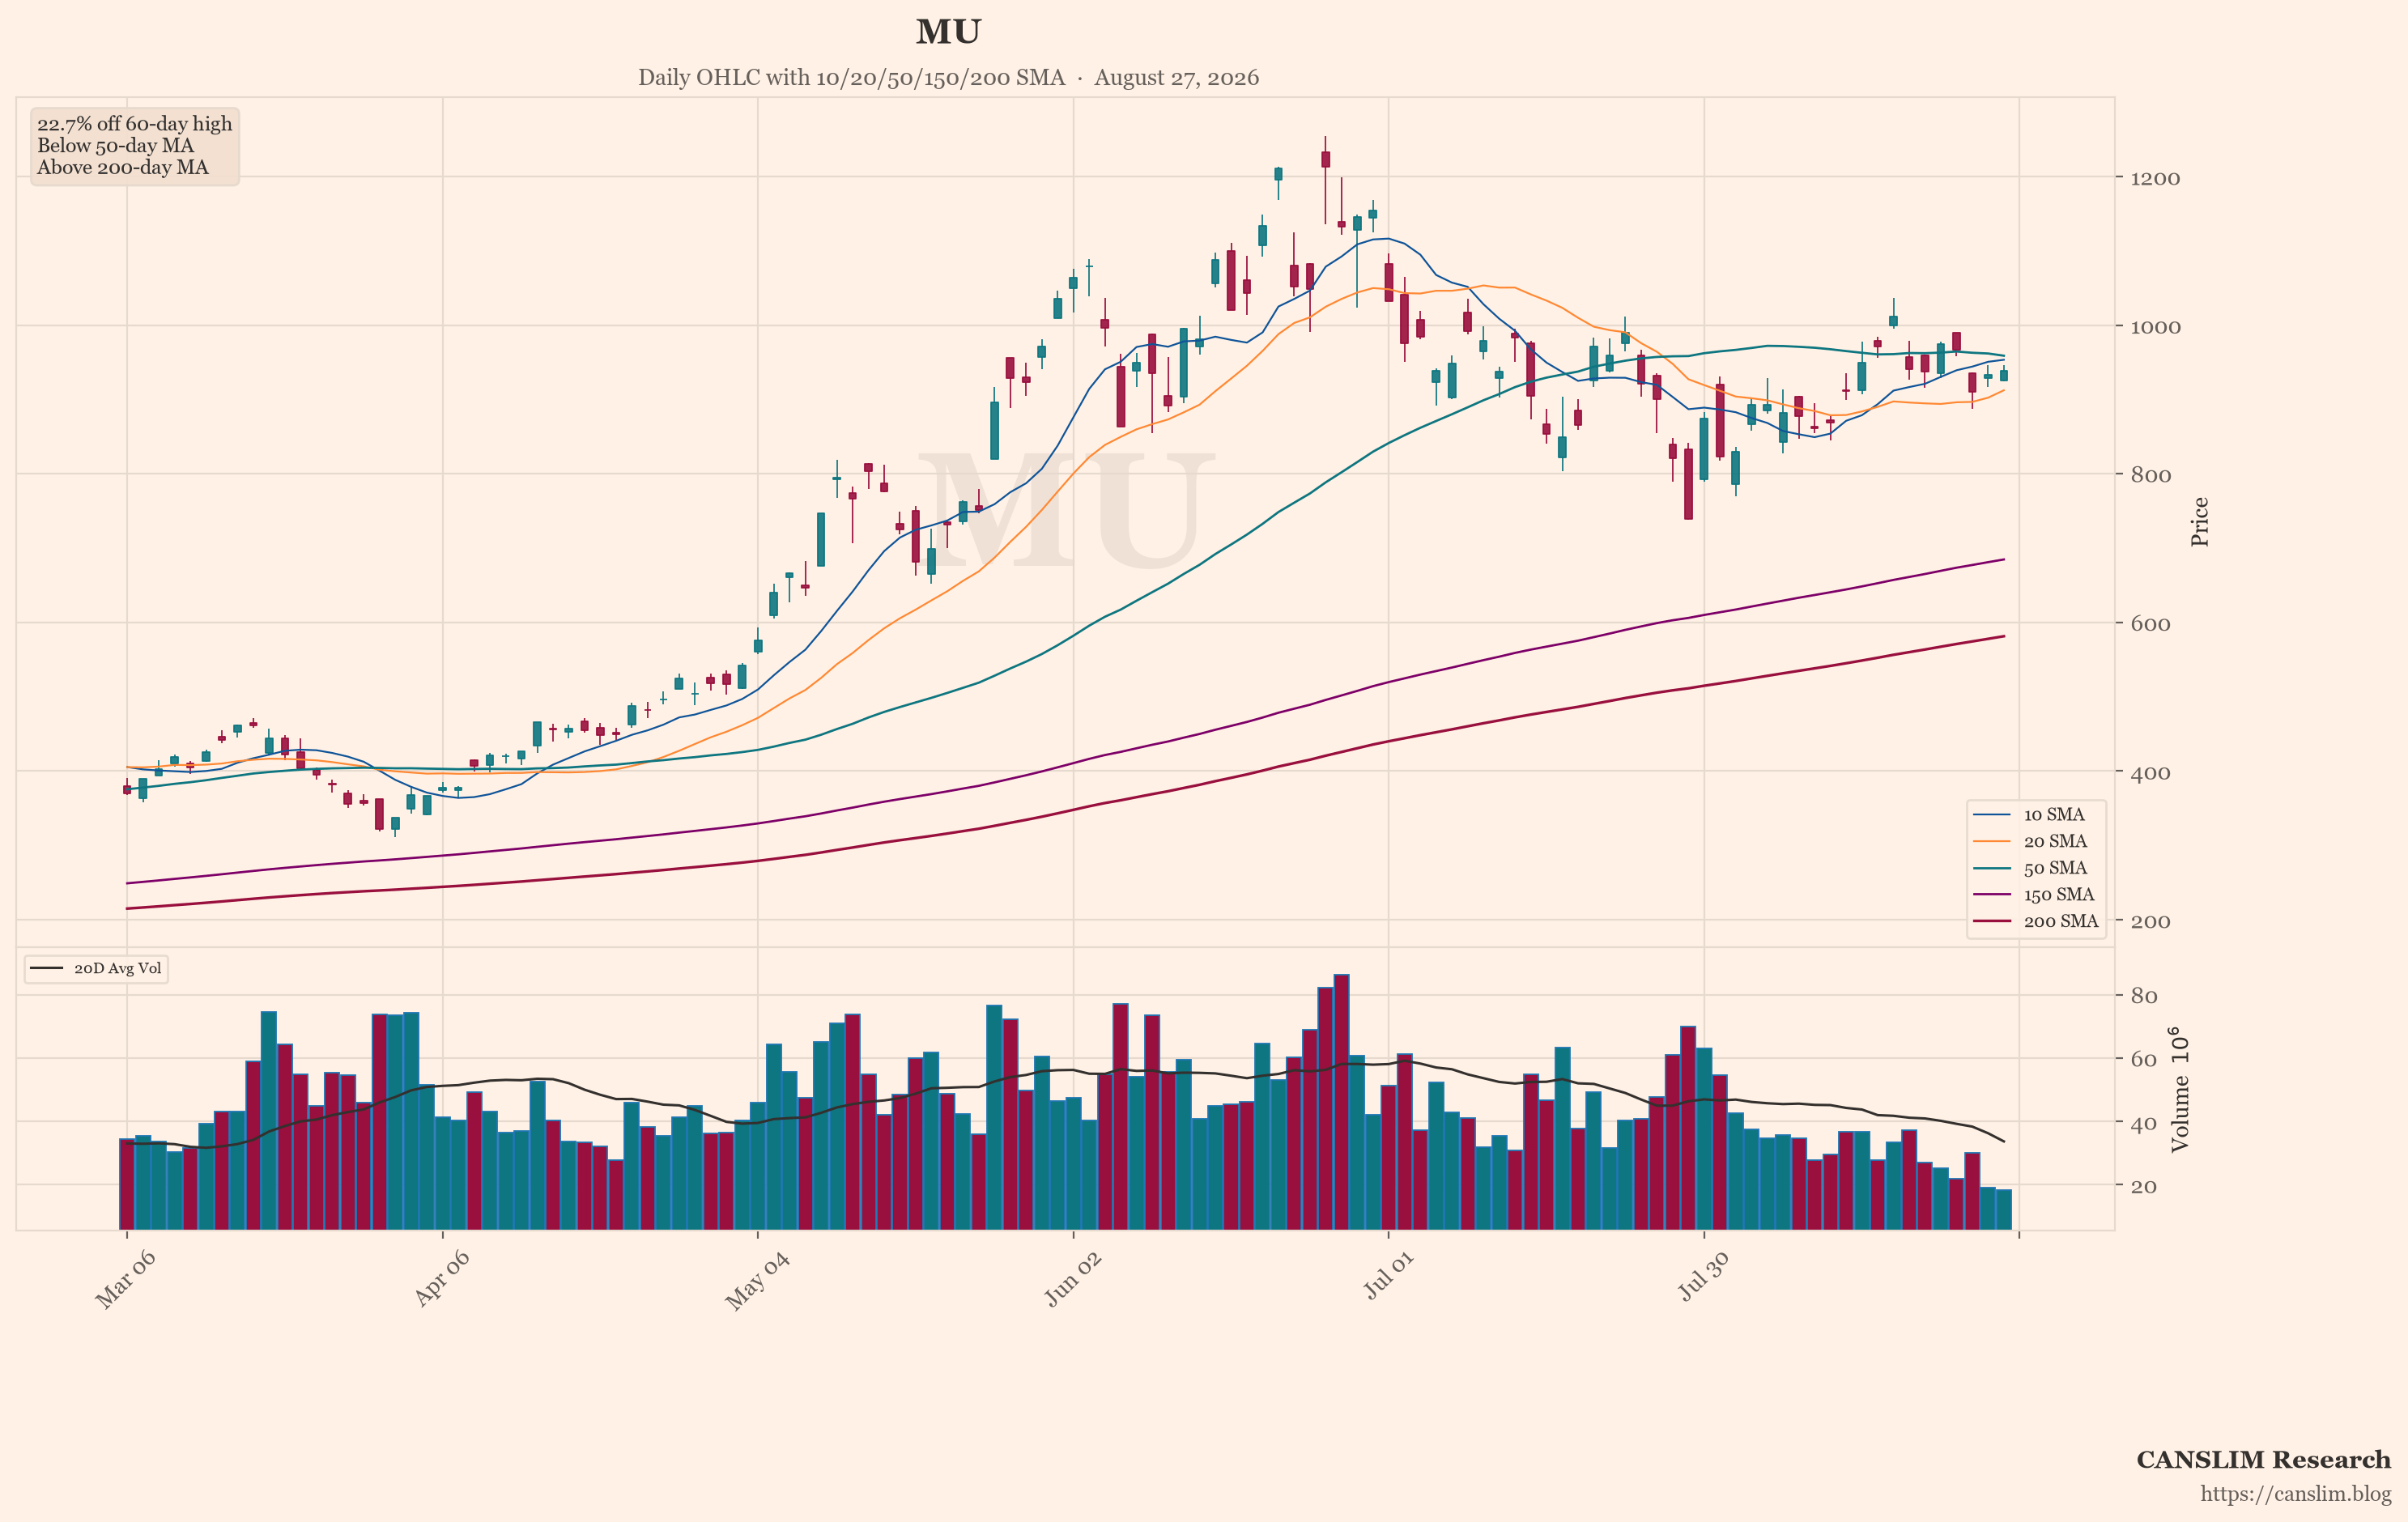
The most discussed sector on global social sentiment is memory chips. MU traded near $864 premarket, while SNDK closed Friday at $1,211.61. Nine consecutive down weeks have turned the debate into a bitter autopsy. Bulls still argue that Micron’s capacity is sold out through 2027 and that Apple’s memory cost pressure proves price hikes are real. Bears point to forced liquidation among leveraged Korean investors and a supply chain that cannot catch a bid. The crowd’s language has shifted from “you don’t understand supply and demand” to “I’m sick of hearing the word cyclical.” One user admitted their account is down 25% because of leveraged memory positions. The only short-term hope is Micron’s KeyBanc presentation at 10:00 ET, but most traders have already stopped expecting a miracle. This is capitulation in its rawest form, and it is happening in a sector that was the market’s darling just two months ago.
A Rocket Stock Rises While Insiders Stay Quiet
The lockup expiration for SPCX did not trigger the expected selloff. Instead, the stock rose to $134.80 premarket after insiders refused to sell their shares. The first earnings report showed $7.8 billion in revenue, up 92% year over year. The online crowd is split into three camps. Momentum buyers are calling for $150. Valuation-focused investors say fair value is $20 because rockets are only a small part of the story. And those who missed the move are admitting they almost pulled the trigger at $115. The harshest mockery is reserved for the company’s failed rocket test, but the price action tells a different story. Insiders holding through a lockup is a powerful signal. It suggests that the people who know the business best see more upside ahead. This is the kind of divergence that growth investors should study closely.
The Rotation Is Brutal and the Crowd Is Confused
The overall market sentiment is “moderately bullish at the index level but extremely divided at the individual-stock level.” The S&P 500 closed Friday at 7,757.64, and JPMorgan raised its year-end target to 8,000. Yet the online crowd labeled a 0.05% premarket decline “Black Monday.” That mismatch is telling. The crowd is uncomfortable with calm. They are used to volatility, and when the index grinds sideways ahead of CPI, they see danger. Meanwhile, space and eVTOL names are being chased higher premarket. ACHR jumped 26% to $6.60 after acquiring Boeing’s eVTOL assets, including Wisk Aero and Insitu. Boeing gets a 20% equity stake and a board seat. This is classic rotation. Money is leaving memory chips and entering narrative-driven growth stories. The crowd’s fear and greed gauge reads 64, which is bullish but not extreme. Cash gang members are sitting on the sidelines, unable to find bargains. That is a sign of a mature bull market, not a top.
The Yield Trap That Looks Safe but Isn’t
While the crowd chases rockets, a quieter story is unfolding in business development companies. FDUS offers a 10.9% yield, but the latest quarter showed net investment income falling 19% quarter over quarter. The supplemental dividend was sharply reduced. The stock trades at 1.05x book value, which means the yield is no longer a discount. It is fully priced. Credit quality remains strong, and the portfolio looks clean, but the cushion is thinner than before. This is a classic yield trap for investors who buy income without checking the earnings momentum. The online crowd is not discussing FDUS, but the lesson applies to every high-yield name in this market. If the income stream is not growing, the premium to NAV is vulnerable. In a market where investors have plenty of other yield options, a flat dividend with falling coverage is a hold at best.
The Divergence Between Crowd Wisdom and Price Action
The most dangerous signal right now is that crowd judgment and price action are moving in the same direction. The community declared memory dead, and memory is indeed weak. They called the index decline “Black Monday,” and the index barely moved. When the crowd is right, it usually means an interim extreme is near. The featured chart for INTC shows the weakest technical pattern, and the dilution news only confirms that weakness. But the broader market is not breaking down. It is rotating. The leaders are holding firm while the laggards get sold. For growth investors, this is the time to focus on stocks with strong relative strength and avoid names that are issuing shares to fund capex. The crowd is nervous, but the tape is telling a different story. The index is near highs, and the rotation is healthy. The real risk is not a crash. It is owning the wrong stock in a market that rewards precision over enthusiasm.
Sources: market news brief & global social sentiment data. Updated 2026-08-10 22:01 HKT. For educational purposes only — not investment advice.
Discover more from CANSLIM Research
Subscribe to get the latest posts sent to your email.