 William@CANSLIM Research
Today’s CANSLIM screen produced 26 stocks, with the strongest cluster in group 52 (three names) and groups 13 and 9 each contributing two. The list skews heavily toward extended leaders — most names sit within 5% of their 52-week highs with no proper base structure. Only a handful, like STT and SITM, are actually building bases worth watching.
Stocks mentioned: ATI, ENVA, NTAP, SN, SITM, HALO, CRDO, SNOW, VCTR, CARE, STT, ERO, SKWD, GRMN, MGNI, NET, WT, EXPE, ATEYY, PAY
What This Screen Shows
I went through all 26 names this morning. The first thing that jumps out: this is a late-stage tape. Most of these stocks have already made their big moves. They’re extended, sitting 20-40% above their 50-day lines, with no fresh base to buy from. That’s not a criticism of the stocks — it’s a comment on timing.
The strongest groups today are financials (group 52) with three names, and semiconductors (group 13) plus software (group 9) with two each. That tells me institutional money is rotating through financials right now, while tech leaders take a breather.
Why These Stocks Qualify
Every name on this list passed the CANSLIM screen, which means they score well on the IBD ratings. The RS Rating measures price strength on a 1-99 scale — an RS of 98 means the stock is outperforming 98% of the market over the past year. That’s the “L” in CANSLIM: leaders, not laggards. The EPS Rating does the same for earnings growth, covering the “C” and “A” criteria. The Composite Rating blends both into one score.
High ratings tell you a stock has been strong. They don’t tell you if it’s safe to buy right now. That’s where chart reading comes in.
ATI

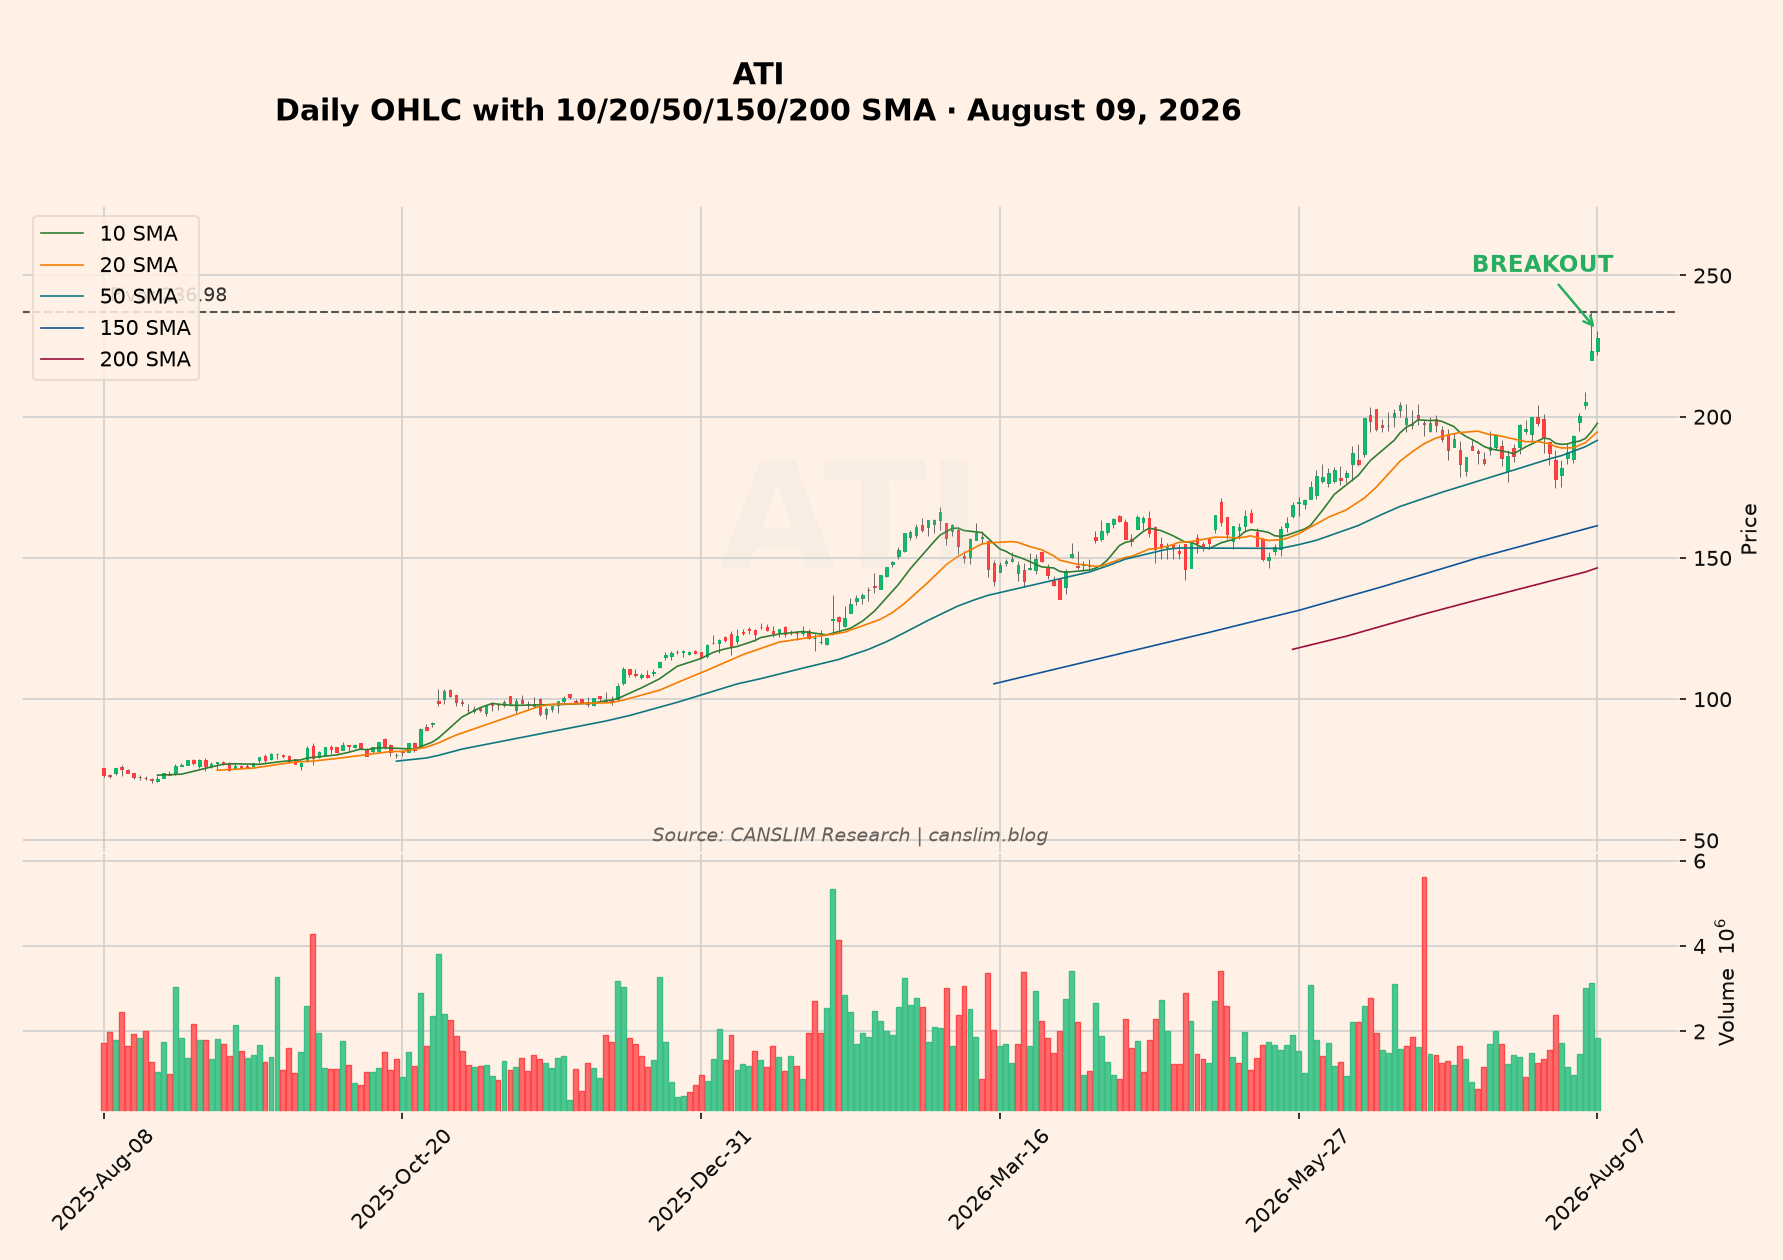
ATI daily chart — 10/20/50/150/200-day moving averages with volume. Pattern: At 52-week high (no base yet)
ATI sits at a 52-week high with an RS Rating of 98 and an EPS Rating of 96. The stock is 18.9% above its 50-day line at $191.64, and just 3.9% off its high. The up/down volume ratio of 2.18 is strong accumulation — buyers are in control.
But here’s the problem: there’s no base. The stock is only 1 session past its high, with a base depth of 7.2% over essentially zero weeks. That’s not a pattern; that’s a stock running. The 10-day average daily range of 5.09% is wider than the prior 30-day range of 3.84%, so volatility is expanding, not contracting.
Verdict: Under accumulation, but extended. No buy point here.
ENVA

ENVA daily chart — 10/20/50/150/200-day moving averages with volume. Pattern: At 52-week high (no base yet)
ENVA shows an RS Rating of 97 and a Composite of 99. Price sits at $252.64, about 16% above the 50-day at $217.80. The 200-day is rising at $165.21, so the long-term trend is solid.
What concerns me: the up/down volume ratio is 0.66, which means selling pressure has been heavier than buying over the past 20 days. That’s distribution. The 10-day average range of 3.44% is actually tighter than the prior 30-day range of 3.86%, so volatility is compressing slightly — but with weak volume, this looks like a stock catching its breath, not coiling for a breakout.
Verdict: Near highs, but volume says be careful. Watch only.
NTAP

NTAP daily chart — 10/20/50/150/200-day moving averages with volume. Pattern: Testing 52-week high (volume not yet confirming)
NTAP is testing its 52-week high at $189.52, with an RS Rating of 97. The stock is 13.5% above its 50-day at $167.00. The up/down volume ratio of 1.29 shows mild accumulation, but the 10d/50d volume ratio of 0.78 tells me volume is drying up.
The base here is only 3 sessions old, 8.0% deep. That’s too early to call a pattern. Volume drying up inside a base can be a good sign — it means sellers are exhausted — but we need more time to confirm.
Verdict: Forming base, but too early. Needs at least 5 weeks.
SN

SN daily chart — 10/20/50/150/200-day moving averages with volume. Pattern: At 52-week high (no base yet)
SN is extended, plain and simple. The stock is 27.7% above its 50-day at $145.29, and just 1.1% off its high. An RS Rating of 96 confirms the strength, but buying here means buying 28% above the short-term average. That’s chasing.
The up/down volume ratio of 1.16 is okay, but the daily range of 4.26% over the last 10 days is wider than the prior 30-day range of 3.53%. Volatility is expanding, not contracting. No base exists — the stock is 0 sessions past its high.
Verdict: Extended. No base. No buy point.

Subscribe to continue reading
Become a paid subscriber to get access to the rest of this post and other exclusive content.

