 William@CANSLIM Research
I ran another CAN SLIM screen this morning and 51 stocks made the cut. Energy is the strongest group with 8 names, followed by Financial Services and Biotech with 7 each. What caught my eye is the mix — we’ve got some tight bases forming near highs, but also a few names that look extended and risky. Let’s dig into the charts.
Why These Stocks Qualify as CAN SLIM
Every stock on this list passes the core CAN SLIM fundamentals. They all show quarterly EPS growth of at least 20% and revenue growth of at least 20%. That’s the C and A in CAN SLIM. The screen also requires an EPS rating of 75 or higher and a composite rating of 80 or higher, which covers the quality and relative strength pieces. Add in the price being within 15% of the 52-week high, and you’ve got the N for new highs and S for supply and demand working in your favor. The M — market direction — is on you to judge.
Stock-by-Stock Analysis
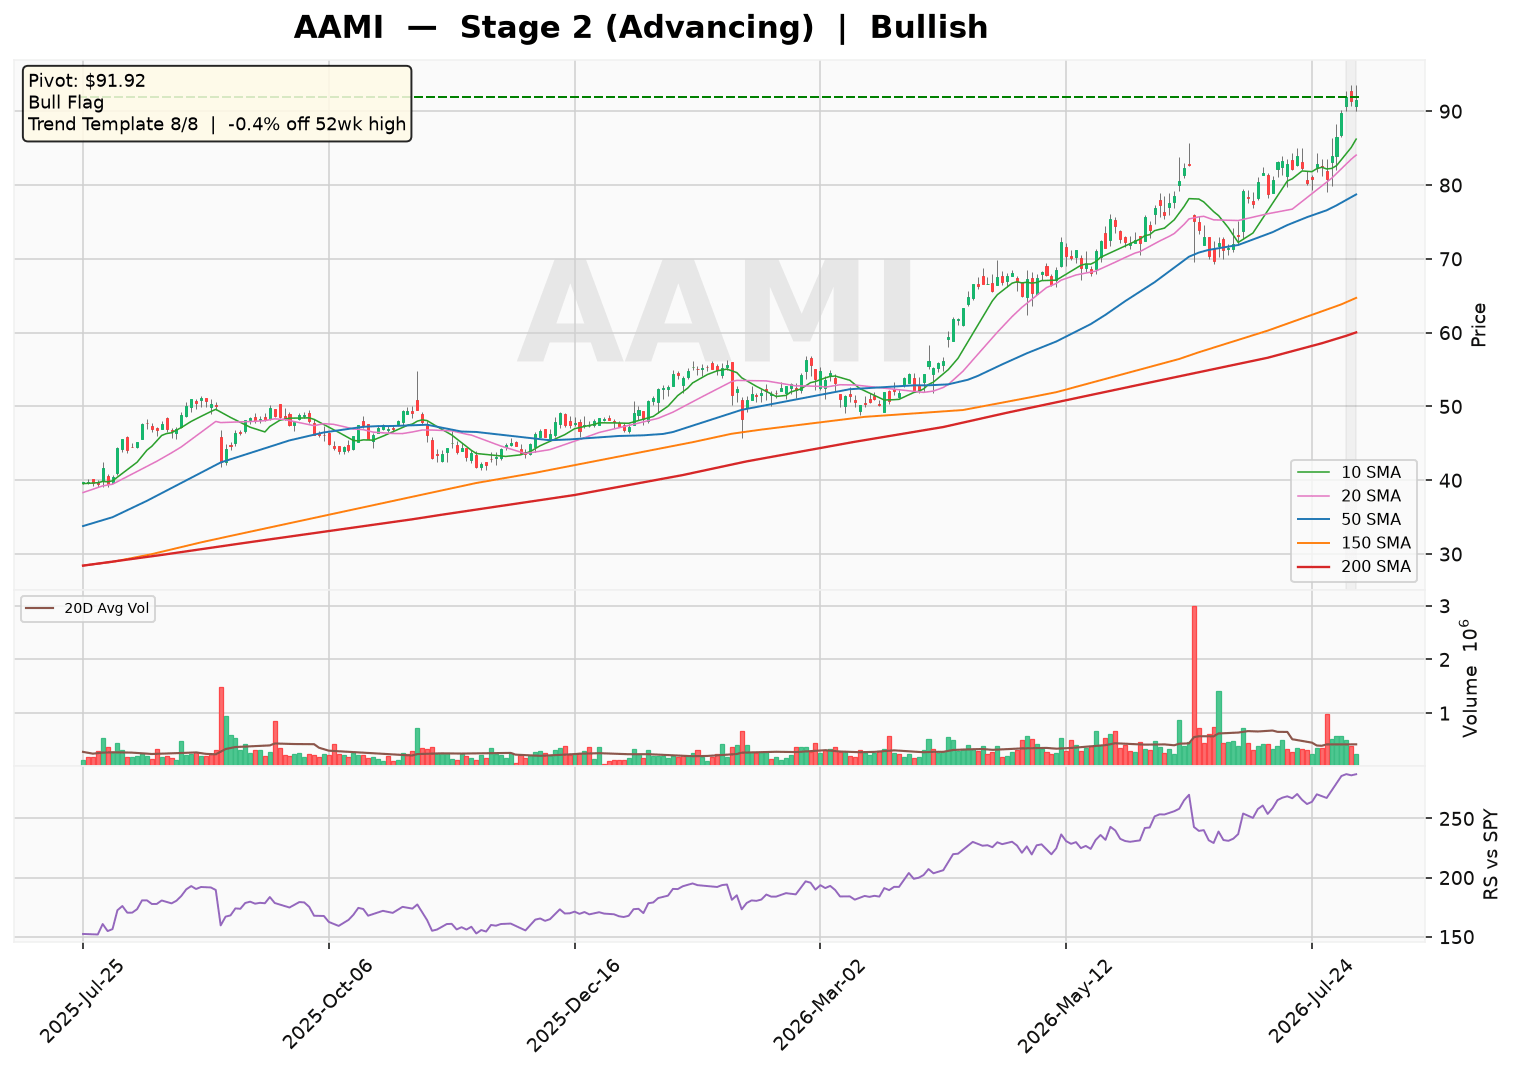
AAMI — Near highs, but no base yet. Watch only.

AAMI is sitting at a 52-week high with no base structure. That’s a red flag for me. The stock is 17.8% above its 50-day moving average, which puts it in extended territory. Up/down volume is 1.52, showing accumulation, but the daily range is not tightening. I’d wait for a proper base to form before considering this one.
AMD — Early cup base, not ready yet.

AMD is building a cup-shaped base that’s 27.5% deep and only 4.8 weeks old. That’s too early — a cup needs at least 7 weeks to mature. The contraction sequence is 14.8% to 19.9% to 23.8%, which is getting wider, not tighter. That’s not a valid VCP. The stock is below its 10 and 20-day MAs, and up/down volume is 0.92, slightly bearish. This one needs more time.
AMG — At highs, volume drying up. Constructive but early.

AMG is at a 52-week high with no base. The stock is 10.5% above its 50-day MA, which is getting extended. Up/down volume is 1.46, showing accumulation, but the 10d/50d volume ratio is 0.82, meaning trade is drying up. Volume drying up inside a non-existent base isn’t a setup. I’d watch for a pullback to the 10 or 20-day MA.
ARW — Triple bottom with a pivot. This one’s interesting.

ARW has a triple bottom base that’s 20% deep and 6 weeks old. That’s a bit early — I’d like to see 7 weeks. The pivot is at 220.96, and the stock is trading at 228, so it’s just above the buy point. Up/down volume is 1.66, showing solid accumulation. The contraction sequence is 17.6% to 10.1% to 11.5% — not perfectly shrinking, but close. This is a forming base worth watching for a proper breakout.
ATLC — Tight contraction near highs. Constructive.

ATLC is at a 52-week high with no base, but the daily range is tightening — 4.36% over the last 10 days versus 6.36% prior. That’s a good sign. Up/down volume is 1.58, showing accumulation. The stock is 14.5% above its 50-day MA, which is a bit extended. I like the tape here, but I’d want a pullback to the 10-day MA before jumping in.
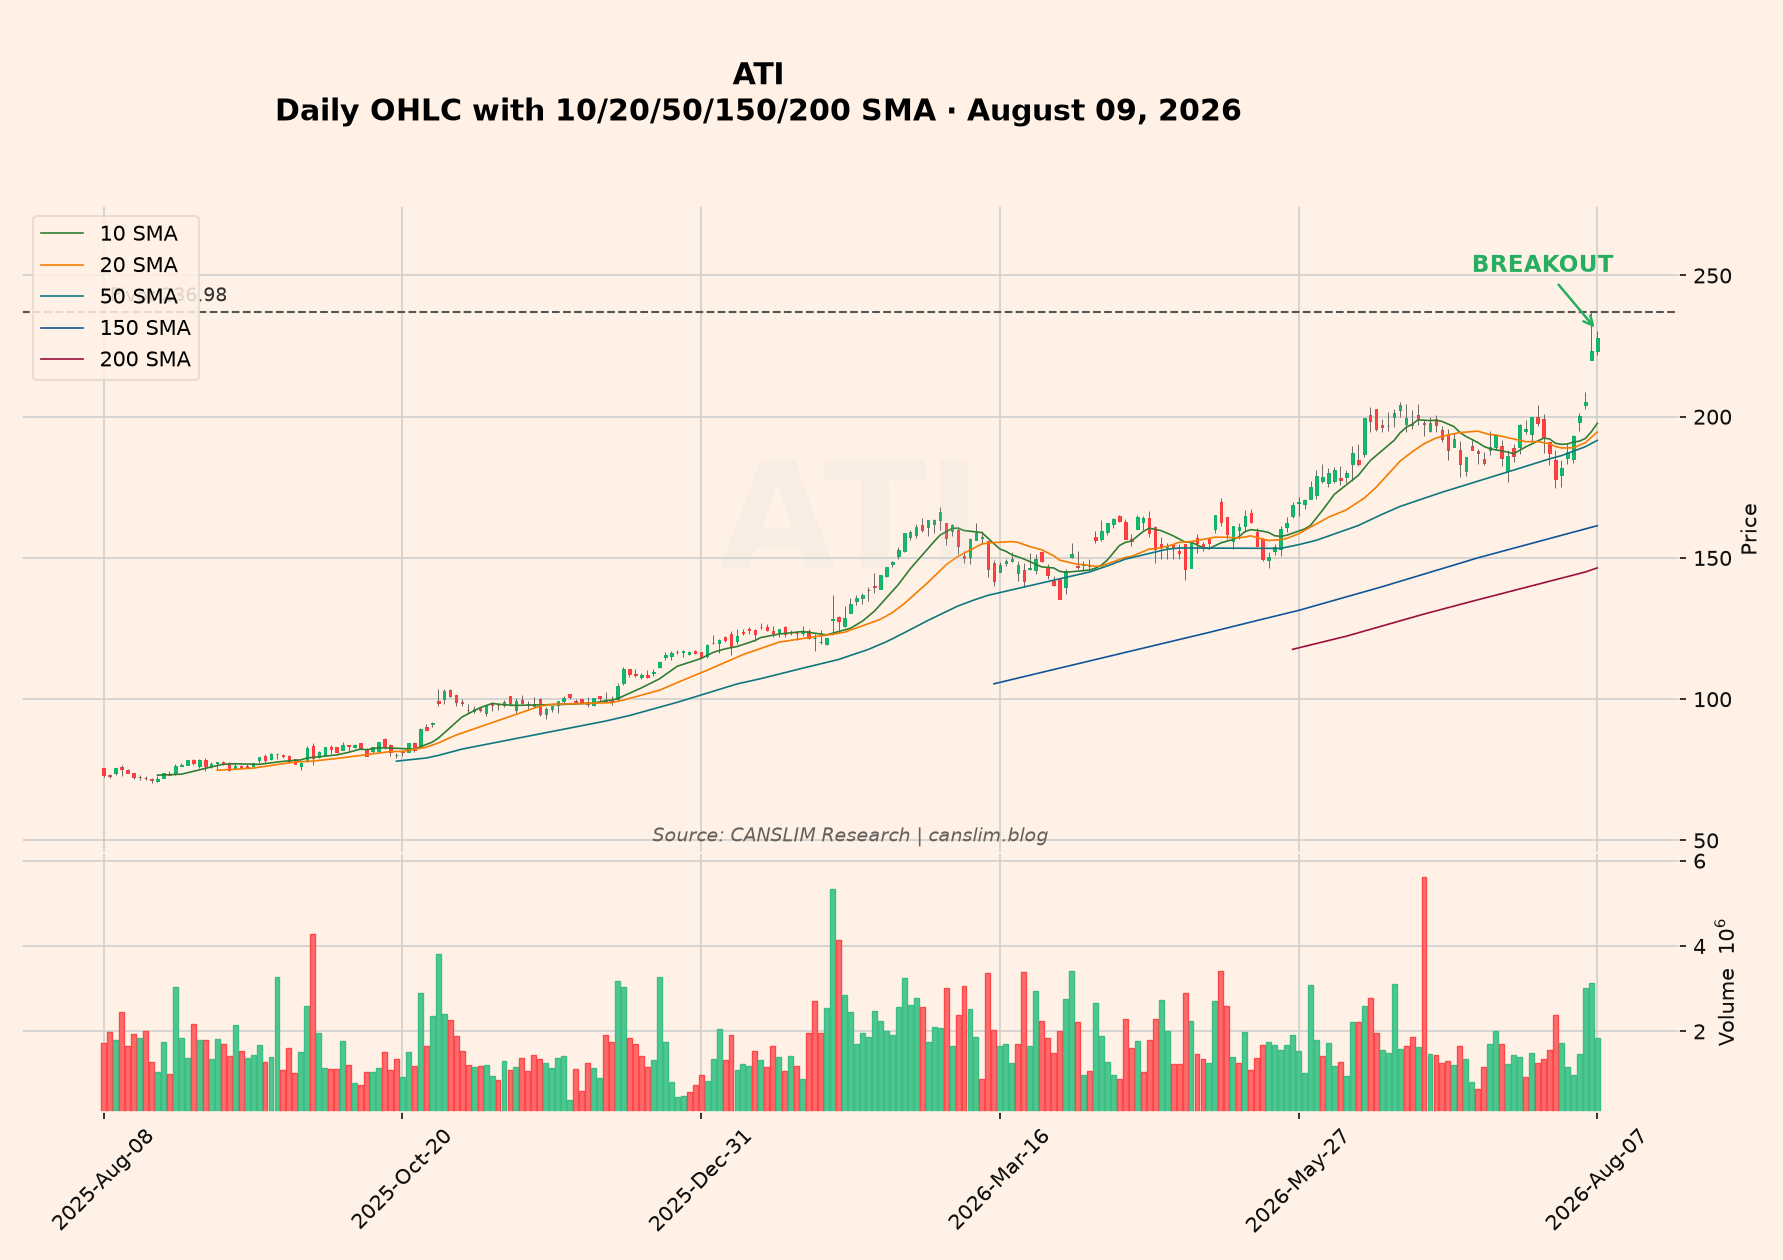
AVT — Triple bottom, volume drying up. Watch for pivot.

AVT has a triple bottom that’s 15.9% deep and 8.6 weeks old. That’s mature enough. The pivot is at 91.32, and the stock is at 92, right in the buy zone. Up/down volume is 1.57, showing accumulation. Volume is drying up inside the base, which is what you want to see. The contraction sequence is 13.1% to 12.7% to 12.0% — shrinking, but barely. This is a solid setup, but I’d want to see volume confirm the breakout.
BTSG — Early cup base, distribution. Watch only.

BTSG is in a cup base that’s only 1.2 weeks old. Way too early. The stock is below its 50-day MA and up/down volume is 0.55, which is heavy distribution. The daily range is expanding, not tightening. This one worries me. Institutions are selling, not buying. Skip it.
CARE — Under accumulation. Strong volume.

CARE is at a 52-week high with no base, but the up/down volume ratio is 2.43. That’s massive accumulation. The stock is 13.4% above its 50-day MA, which is extended. The 10d/50d volume ratio is 1.09, showing trade is heating up. This is under accumulation, but chasing here is late. I’d wait for a pullback.
CDNA — Extended. Way too far above the 50-day.

CDNA is 60.3% above its 50-day MA. That’s extremely extended. The stock is at a 52-week high with no base. Up/down volume is 1.39, showing some accumulation, but the risk here is enormous. Chasing this is asking for trouble. Wait for a serious pullback or a new base to form.
DAVE — Early cup base, volume drying up. Not ready.

DAVE is in a cup base that’s 20.6% deep and only 2 weeks old. Too early. The stock is 24.1% above its 50-day MA, which is extended. Volume is drying up inside the base, which is good, but the base isn’t mature. The 10d/50d volume ratio is 0.64, showing trade is drying up. I’d wait for this base to develop further.
DELL — At highs, volume drying up. Watch only.

DELL is at a 52-week high with no base. The stock is 14.8% above its 50-day MA. Up/down volume is 1.06, which is neutral. Volume is drying up inside the non-existent base, and the 10d/50d ratio is 0.64. The daily range is wide at 7.79%, showing volatility. This one doesn’t have a clean setup. I’d pass.
DINO — Bull flag with a strong pole. This is a setup.

DINO has a bull flag with a +37.2% pole over 20 sessions. The flag is 5 sessions deep at 9.2%. That’s a proper flag. Up/down volume is 1.63, showing accumulation. The stock is 15.2% above its 50-day MA, which is a bit extended. A proper breakout would need a new high on heavy volume. I like this one, but I’d wait for that breakout confirmation.
ENVA — At highs, distribution showing. Watch only.

ENVA is at a 52-week high with no base. The stock is 21.6% above its 50-day MA, which is extended. Up/down volume is 0.75, showing distribution. That’s a red flag. The 10d/50d volume ratio is 1.13, so trade is heating up, but in the wrong direction. This one worries me. I’d stay away.
ESTA — At highs, volume drying up. Constructive but early.

ESTA is at a 52-week high with no base. The stock is 11.1% above its 50-day MA. Up/down volume is 1.53, showing accumulation. Volume is drying up inside the non-existent base. The daily range is tightening — 3.69% versus 4.74% prior. That’s a good sign. I’d watch for a pullback to the 10-day MA.
FENC — Double bottom, volume drying up. Watch for pivot.

FENC has a double bottom that’s 16.9% deep and 5 weeks old. That’s a bit early. The pivot is at 11.24, and the stock is at 10, below the buy point. Up/down volume is 1.36, showing accumulation. Volume is drying up inside the base. The contraction sequence is 11.2% to 13.0% to 12.6% — not shrinking. This is a forming base, but I’d wait for it to mature.
FLYW — Pullback to 20MA. Normal rest in an uptrend.

FLYW is pulling back to its 20-day MA, which is a normal rest in an uptrend. The stock is 4.7% above its 50-day MA, which is healthy. Up/down volume is 0.6, showing distribution. That’s a concern. The 50-day MA is rising, so the trend is intact. I’d watch to see if the 20-day MA holds.
FROG — Bear flag. This is a warning.

FROG has a bear flag — a -27.3% drop followed by a weak drift. That’s not a bullish setup. The stock is still 13.1% below its high. Up/down volume is 0.85, showing mild distribution. The contraction sequence is 10.6% to 16.1% to 17.0%, getting wider. This is not a valid VCP. I’d stay away.
GKOS — Testing highs, volume not confirming. Watch only.

GKOS is testing its 52-week high, but volume is not confirming. The stock is 22.4% above its 50-day MA, which is extended. Up/down volume is 1.34, showing some accumulation. The daily range is expanding — 5.11% versus 3.99% prior. I’d want to see volume confirm a breakout before considering this one.
GLBE — Double bottom, but too deep. Watch only.

GLBE has a double bottom that’s 36% deep. That’s too deep — O’Neil says anything over 33% is failure-prone. The base is 30.8 weeks old, which is mature, but the depth is a problem. Up/down volume is 0.91, neutral. The contraction sequence is 29.7% to 27.3% to 32.6%, not shrinking. This one has too much risk.
HSHP — Mature cup base with shrinking contractions. This is a setup.

HSHP has a cup base that’s 22.5% deep and 11.2 weeks old. That’s mature. The contraction sequence is 16.1% to 15.7% to 12.0% — shrinking. That’s a valid VCP pattern. Up/down volume is 1.0, neutral, but the volume drying up inside the base is a good sign. The stock is 5.6% above its 50-day MA, which is healthy. I like this one. Watch for a breakout on volume.
How I Would Use This List
This list gives you the strongest fundamental stocks, but the chart work is where you separate winners from losers. Wait for proper pivots — a breakout on volume from a mature base. Respect the 7-8% stop loss rule. If a stock drops 7-8% from your buy point, cut it. And always judge the general market yourself. In a bear market, even the best setups fail.
FAQ
What is the CAN SLIM screen?
The CAN SLIM screen is a stock filter based on William O’Neil’s investing strategy. It looks for stocks with strong earnings growth, revenue growth, high ratings, and proximity to 52-week highs. The goal is to find institutional-quality growth stocks before they make big moves.
What does “extended” mean in stock charts?
Extended means a stock has moved too far above its key moving averages, usually the 50-day. When a stock is more than 15-20% above its 50-day MA, it’s considered extended. Buying at that point is risky because the stock is due for a pullback.
What is a volatility contraction?
A volatility contraction is when a stock’s daily price range narrows over time. It shows that sellers are losing power and the stock is coiling for a move. When combined with shrinking pullbacks, it forms a VCP — a volatility contraction pattern. That’s a bullish setup.
This content is for educational purposes only and is not financial advice.
Discover more from CANSLIM Research
Subscribe to get the latest posts sent to your email.