 Andrew@CANSLIM RESEARCH
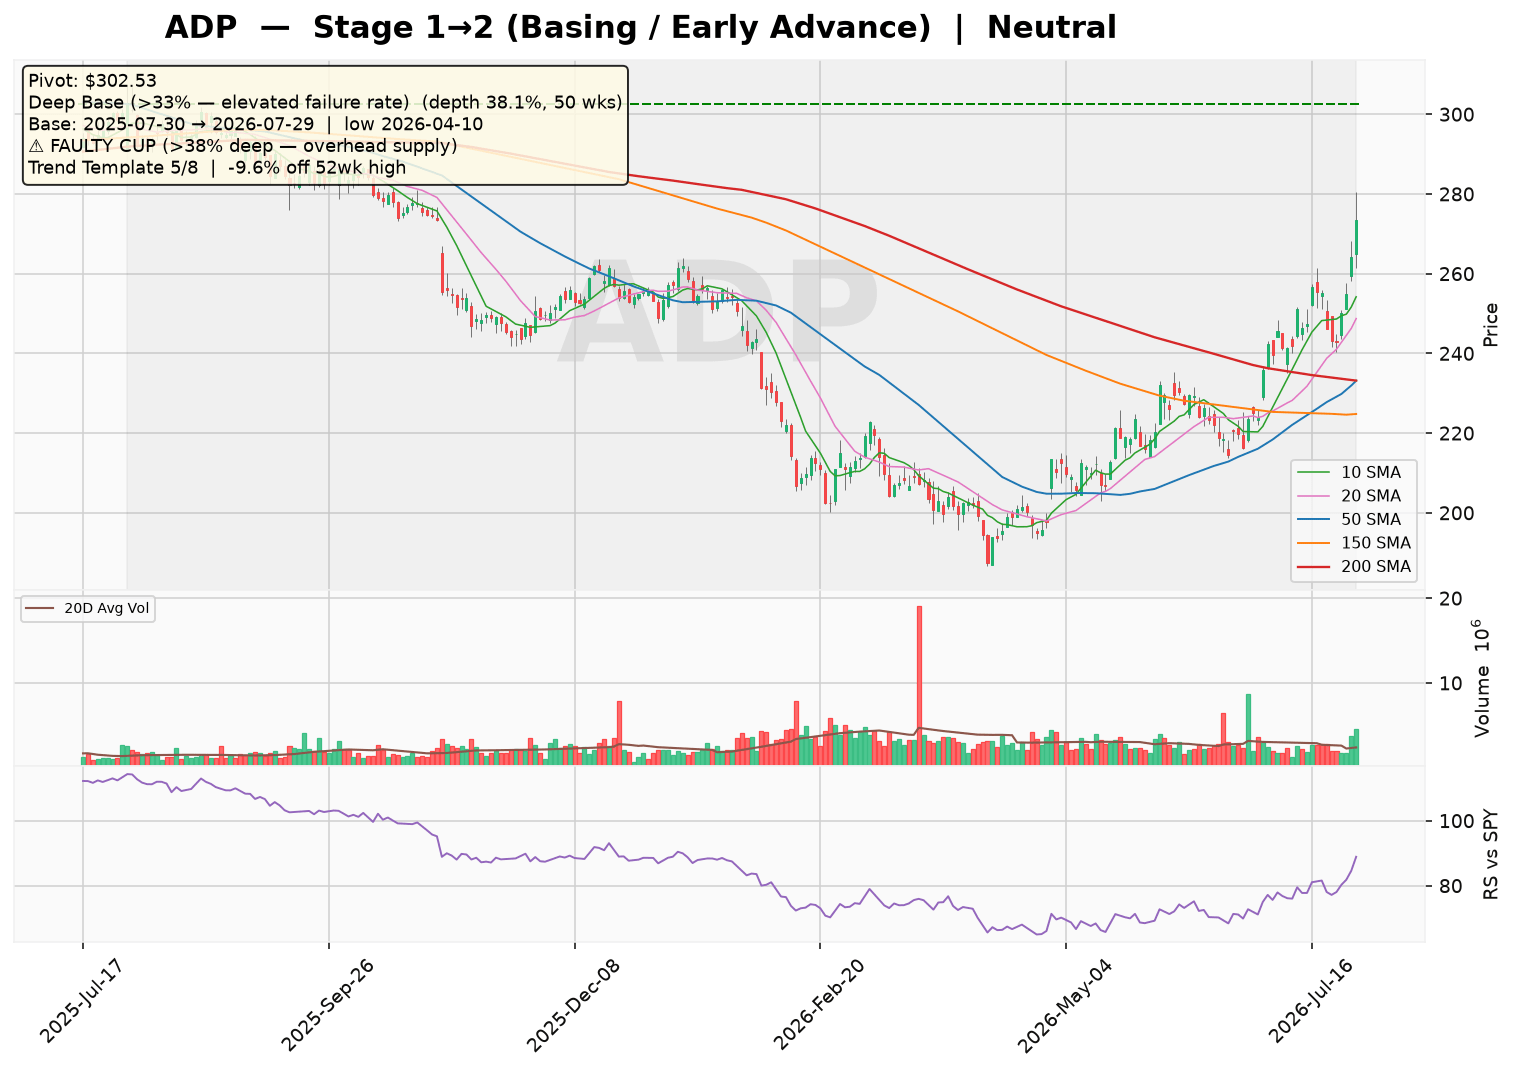
ADP is currently in a Stage 1→2 transition, with the 30-week MA flattening and price trading above it, suggesting a basing phase ahead of a potential advance. However, the stock has formed a deep 50-week base with a 38.1% correction, which carries an elevated failure rate, and the overall sentiment remains neutral — wait and see. Key trend template checks show mixed signals, with only 5 of 8 conditions met, including price above its 50-day MA and a strong RS line near a 3-month high.

Technical Analysis
As of 2026-07-29 · Close $273.37
Stage Analysis
Stage 1→2 (Basing / Early Advance) — 30-week MA flattening with price above it — basing ahead of a potential advance
(30-week MA 6-week slope: -0.19%)
Detected Patterns — What the Market Is Watching
- Deep Base (>33% — elevated failure rate) — depth 38.1%, length 50 weeks, pivot $302.53. Base formed from 2025-07-30 (left-side high) to 2026-07-29, with the low of $187.37 set on 2026-04-10
⚠️ Faulty cup warning: the base is 38.1% deep (above the 38–40% threshold). A correction this deep leaves heavy overhead supply — trapped holders from higher prices are likely to sell into any rally, raising the failure rate of a breakout from this base.
Minervini Trend Template — 5/8 Criteria Passed
| Criterion | Status |
|---|---|
| Price > 150MA & 200MA | ✅ Pass |
| 150MA > 200MA | ❌ Fail |
| 200MA trending up (>=1 month) | ❌ Fail |
| 50MA > 150MA & 200MA | ❌ Fail |
| Price > 50MA | ✅ Pass |
| Price >= 30% above 52wk low | ✅ Pass |
| Price within 25% of 52wk high | ✅ Pass |
| RS Line at/near 3-month high | ✅ Pass |
Price is -9.6% off its 52-week high and 45.9% above its 52-week low.
Pattern Sentiment
Neutral — wait and see (composite score: -1)
Automatic Data Processing, Inc. (NYSE: ADP)
In-Depth Fundamental Research Report
Report Date: July 30, 2026
Analyst: Institutional Research Desk
1. Business Model and Revenue Streams
ADP is a leading global provider of cloud-based Human Capital Management (HCM) solutions. The company operates through two primary segments, generating revenue via recurring service fees, implementation fees, and interest on funds held for clients.
Segment Breakdown (FY2025 Estimated)
| Segment | Description | % of Total Revenue (Estimate) |
|---|---|---|
| Employer Services (ES) | Provides payroll, HR, benefits administration, talent management, time & attendance, and compliance solutions. Key platforms include RUN Powered by ADP (small business), ADP Workforce Now (mid-market), and ADP Lyric HCM (enterprise). | ~65% |
| Professional Employer Organization (PEO) | Offers comprehensive HR outsourcing through a co-employment model under the ADP TotalSource brand. Includes benefits, payroll, risk management, and compliance. | ~35% |
Revenue Growth Drivers
- New Business Bookings: The primary leading indicator, driven by new client acquisitions and cross-selling of HCM modules.
- Worksite Employees (PEO): Growth in the number of employees under PEO co-employment contracts.
- Interest on Client Funds: Revenue from the float on funds held for payroll tax and other payments. This is sensitive to interest rate levels.
- Pricing: Annual price increases on existing contracts.
Geographic Exposure (FY2025 Estimate)
| Region | % of Revenue (Estimate) |
|---|---|
| United States | ~90% |
| International (Europe, Canada, Asia, Latin America) | ~10% |
2. Supply Chain and Customer Base
Customer Base
ADP serves over 1 million clients globally, ranging from small businesses to multinational enterprises. The customer base is highly diversified, with no single client representing more than 1% of total revenue. The PEO segment’s concentration is tied to the number of worksite employees, which was approximately 800,000 as of FY2025 (estimate).
Supply Chain
ADP’s primary “suppliers” are data centers, cloud infrastructure providers (e.g., AWS, Azure), and software vendors. The company also relies on benefits carriers and insurance providers for its PEO segment. No single supplier is considered critical to the point of material disruption, though cloud infrastructure costs are a growing component of Cost of Revenue.
3. Financial Statement Analysis
Balance Sheet Health (As of June 30, 2025)
| Metric | Value | Analysis |
|---|---|---|
| Total Assets | $53.37B | Largely comprised of client funds held as restricted cash ($31.0B). |
| Total Debt | $9.07B | Includes $4.77B in commercial paper (short-term) and $3.97B in long-term debt. |
| Stockholders’ Equity | $6.19B | Relatively low equity base due to aggressive share buybacks. |
| Debt-to-Equity | 69.3% | Moderate leverage; manageable given strong cash flows. |
| Current Ratio | 1.04 | Healthy, supported by high levels of client cash. |
| Quick Ratio | 0.13 | Low due to classification of client funds as restricted cash; core operating liquidity is strong. |
| Interest Coverage (EBIT / Interest Expense) | 12.6x | Comfortable coverage; earnings easily service debt obligations. |
Income Statement & Profitability (FY2021 – FY2025)
| Fiscal Year | Revenue ($B) | Revenue Growth | Net Income ($B) | Net Income Growth | Diluted EPS | Gross Margin | Operating Margin | Net Margin |
|---|---|---|---|---|---|---|---|---|
| 2021 | 15.01 | 3.0% | 2.60 | 7.0% | $6.17 | 45.5% | 25.0% | 17.3% |
| 2022 | 16.50 | 9.9% | 2.95 | 13.5% | $7.00 | 42.6% | 23.1% | 17.9% |
| 2023 | 18.01 | 9.2% | 3.41 | 15.6% | $8.21 | 44.7% | 25.0% | 18.9% |
| 2024 | 19.20 | 6.6% | 3.75 | 10.0% | $9.10 | 45.4% | 25.8% | 19.5% |
| 2025 | 20.56 | 7.1% | 4.08 | 8.8% | $9.98 | 46.0% | 26.3% | 19.8% |
| 2026E | 22.00 | 7.0% | 4.40 | 7.8% | $10.80 | 46.5% | 27.0% | 20.0% |
| 2027E | 23.50 | 6.8% | 4.75 | 8.0% | $11.70 | 47.0% | 27.5% | 20.2% |
Note: FY2021 data is from public filings; FY2026E and FY2027E are analyst estimates. Revenue growth is organic.
Valuation Metrics
| Metric | Value |
|---|---|
| Trailing P/E (as of 7/30/2026) | 25.5x |
| Forward P/E (FY2026E) | 20.5x |
| Price-to-Sales (TTM) | 5.1x |
| PEG Ratio | 2.47 |
Cash Flow Analysis (FY2021 – FY2025)
| Metric ($B) | FY2021 | FY2022 | FY2023 | FY2024 | FY2025 |
|---|---|---|---|---|---|
| Operating Cash Flow | 4.10 | 3.10 | 4.21 | 4.16 | 5.45 |
| Capital Expenditure | (0.52) | (0.55) | (0.57) | (0.56) | (0.55) |
| Free Cash Flow (FCF) | 3.58 | 2.55 | 3.64 | 3.59 | 4.39 |
| FCF Conversion (FCF / Net Income) | 138% | 86% | 107% | 96% | 108% |
Analysis: ADP is consistently cash-flow positive. The company generates significant free cash flow, which is used primarily for share repurchases, dividends, and strategic M&A. The dip in FY2022 FCF was due to working capital timing. The FY2025 operating cash flow of $5.45B is a record high.
4. Risk and Catalyst Assessment
Risk Factors (Next 12 Months)
- Interest Rate Cuts: A significant portion of ADP’s revenue (~3-4%) comes from interest on client funds. If the Federal Reserve cuts rates aggressively, this revenue stream could compress, impacting overall growth and margins.
- Labor Market Softening: A sharp rise in unemployment would reduce the number of employees being paid via ADP’s platforms and reduce PEO worksite employee growth, directly impacting revenue.
- Competitive Pressure: Increased competition from cloud-native HCM providers (e.g., Rippling, Gusto) and larger ERP players (e.g., Workday, SAP) could pressure pricing and market share, particularly in the mid-market segment.
- Execution Risk on Lyric: The transition of large enterprise clients to the new ADP Lyric HCM platform carries implementation risks. Any major client dissatisfaction or churn could negatively impact sentiment.
Catalysts (Next 12 Months)
- AI Monetization: ADP is integrating generative AI into its platforms (e.g., for HR analytics, compliance, and employee self-service). Successful monetization of these features could drive higher ARPU and margin expansion.
- New Business Bookings Acceleration: Strong momentum in new business bookings, particularly in the mid-market and enterprise segments, would be a positive leading indicator for future revenue.
- Margin Expansion: Continued operating leverage from scale, automation, and AI could drive operating margins toward the 28-30% range, a key investor talking point.
- Capital Returns: ADP is a consistent dividend grower and aggressive share repurchaser. An increase in the buyback authorization or a dividend hike would be viewed favorably.
5. Competitive Landscape and Related Equities
Primary Competitors
| Company | Ticker | Market Share (Estimate) | Notes |
|---|---|---|---|
| Paychex, Inc. | PAYX | ~12% | Direct competitor in small to mid-market payroll and HR. |
| Workday, Inc. | WDAY | ~8% (HCM) | Competes in the enterprise HCM space, particularly for large, complex organizations. |
| Paylocity Holding Corp. | PCTY | ~3% | Cloud-based competitor focused on mid-market HCM and employee experience. |
| TriNet Group, Inc. | TNET | ~2% (PEO) | Direct PEO competitor, targeting small and mid-sized businesses. |
Related Equities (Frequently Mentioned Alongside ADP)
| Ticker | Relationship |
|---|---|
| PAYX | Direct peer; often compared on valuation, growth, and dividend yield. Both are considered defensive, high-quality compounders. |
| WDAY | Competitor in enterprise HCM; ADP is often seen as the more stable, value-oriented play vs. Workday’s higher-growth, higher-multiple profile. |
| MSCI | Not a direct competitor, but both are high-margin, data-driven financial services companies with recurring revenue models, often grouped in “compounders” portfolios. |
6. Investment Thesis and Capital Raising
Investment Thesis
Bull Case: ADP is a high-quality, recession-resistant compounder with a dominant market position in HCM. The company benefits from structural tailwinds (HR digitization, regulatory complexity) and is leveraging AI to drive margin expansion and higher ARPU. Strong free cash flow generation supports a robust capital return program. At 20.5x forward earnings, the stock offers an attractive entry point for long-term investors seeking stability and growth.
Bear Case: ADP’s core payroll market is mature, and growth is heavily dependent on interest income and pricing, both of which face headwinds. Competition from more agile, modern platforms is intensifying. The company’s large size makes it difficult to accelerate organic growth, and any slowdown in the labor market could pressure results. The current valuation, while not extreme, leaves little room for error.
Capital Raising Activities (Last 6 Months & Projections)
| Period | Activity | Details |
|---|---|---|
| Last 6 Months (Feb – Jul 2026) | Debt Issuance | ADP issued $6.75B in debt (likely commercial paper and long-term notes) as per FY2025 cash flow statement. This was used to refinance existing debt and for general corporate purposes. |
| Last 6 Months (Feb – Jul 2026) | Share Repurchases | Continued aggressive buyback program. Repurchased ~$1.28B in stock during FY2025. The pace is expected to continue at ~$1.0-1.2B per quarter (estimate). |
| Next 6 Months (Aug 2026 – Jan 2027) | Dividend Increase | ADP typically increases its dividend in November. We estimate a 10-12% increase to the quarterly dividend, continuing its 40+ year streak of dividend growth. |
| Next 6 Months (Aug 2026 – Jan 2027) | Share Repurchases | We project continued open-market repurchases of ~$1.0-1.2B per quarter, funded by strong free cash flow. |
| Next 6 Months (Aug 2026 – Jan 2027) | M&A (Potential) | ADP may pursue small, tuck-in acquisitions to enhance its AI capabilities or expand into adjacent HCM verticals. No large-scale M&A is anticipated (estimate). |
Note: All projections are estimates based on historical trends and current market conditions.
Disclaimer: This report is for informational and educational purposes only and does not constitute investment advice. Data sourced from Yahoo Finance (as of July 30, 2026) and company filings; all estimates not explicitly sourced from the provided data are clearly labeled as such. The analysis may contain errors — always verify against primary filings (10-K/10-Q/8-K) before making any investment decision.
Discover more from CANSLIM Research
Subscribe to get the latest posts sent to your email.