 Andrew
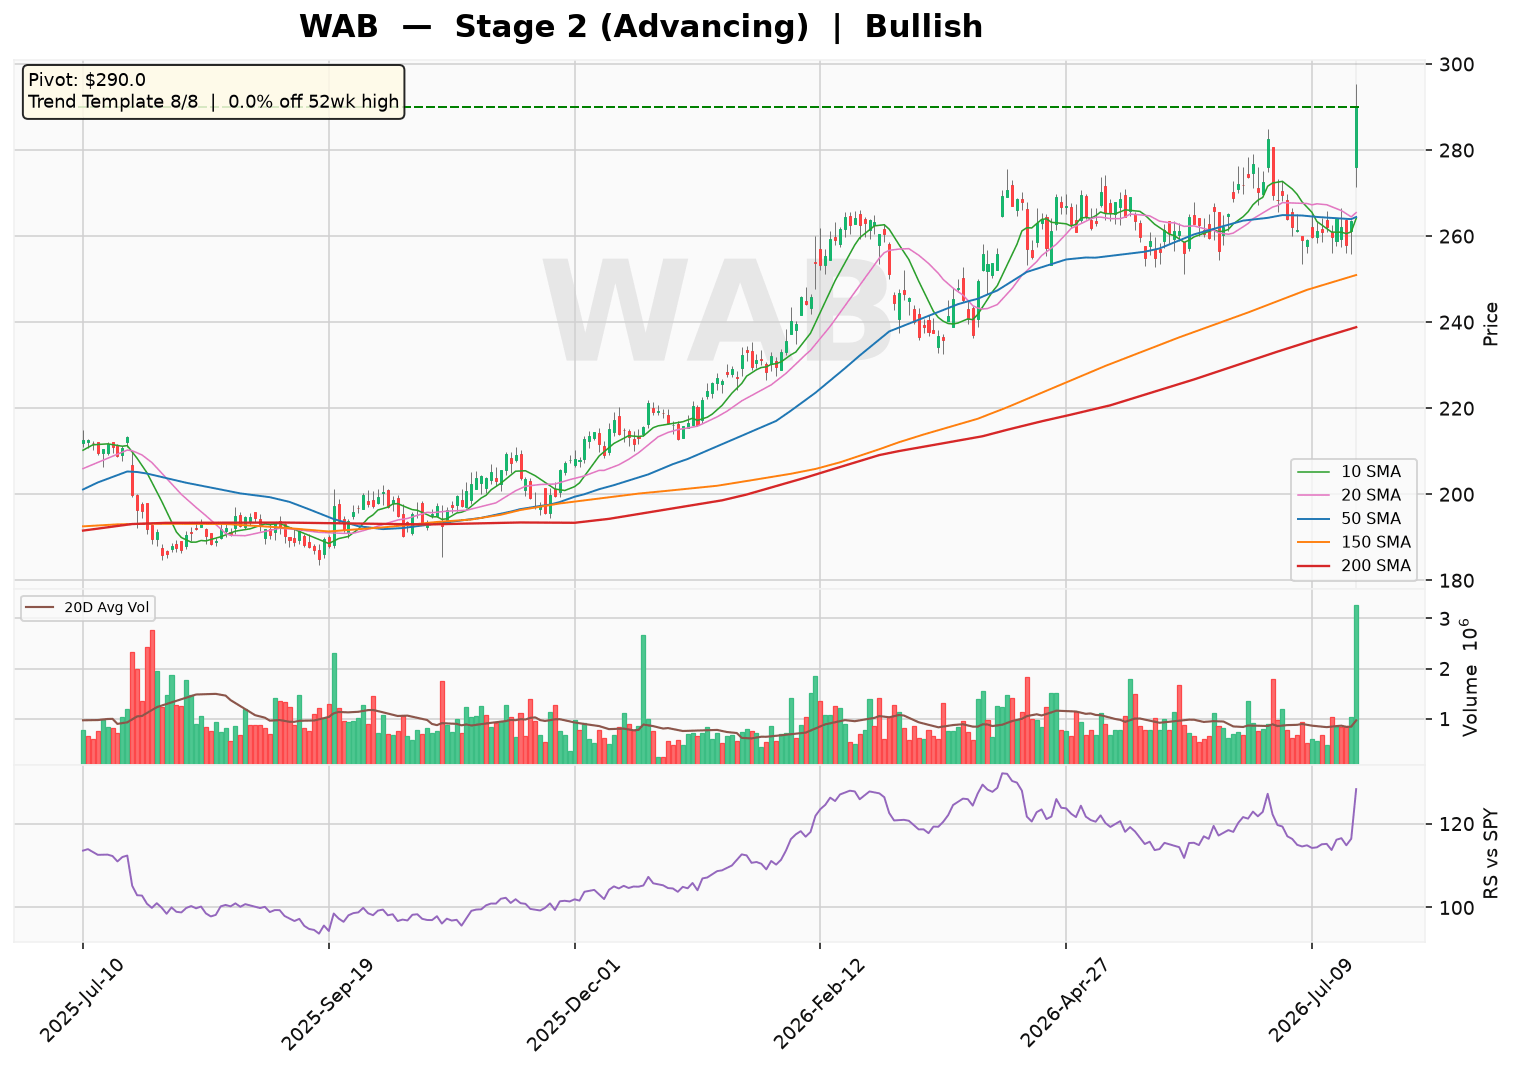
WAB closed at $290.00, holding firmly above its rising 30-week moving average with a 3.73% six-week slope, confirming a Stage 2 advancing uptrend. The stock passes all eight trend template checks, including price above all key moving averages and the RS line at a three-month high, reflecting broad technical strength. With no base formation and the stock at its highs, the overall sentiment is bullish, indicating an offensive setup is in place.
Technical Analysis
As of 2026-07-22 · Close $290.0
Stage Analysis
Stage 2 (Advancing) — Price holding above a rising 30-week MA — uptrend intact
(30-week MA 6-week slope: 3.73%)
Detected Patterns — What the Market Is Watching
- No actionable pattern detected at this time.
Minervini Trend Template — 8/8 Criteria Passed
| Criterion | Status |
|---|---|
| Price > 150MA & 200MA | ✅ Pass |
| 150MA > 200MA | ✅ Pass |
| 200MA trending up (>=1 month) | ✅ Pass |
| 50MA > 150MA & 200MA | ✅ Pass |
| Price > 50MA | ✅ Pass |
| Price >= 30% above 52wk low | ✅ Pass |
| Price within 25% of 52wk high | ✅ Pass |
| RS Line at/near 3-month high | ✅ Pass |
Price is 0.0% off its 52-week high and 56.8% above its 52-week low.
Pattern Sentiment
Bullish — offensive setup in place (composite score: 6)
Westinghouse Air Brake Technologies Corporation (WAB) – Institutional Research Report
Report Date: July 23, 2026
Price (as of close 7/22/26): ~$290.00 (Estimate based on market cap and shares outstanding)
Sector: Industrials
Industry: Railroads
Headquarters: Pittsburgh, Pennsylvania
1. Business Model &Amp; Revenue Streams
Wabtec Corporation is a global provider of equipment, systems, and services for freight rail and passenger transit. The company operates through two segments: Freight and Transit.
Revenue Breakdown (FY2025 – Estimate based on segment data):
| Segment | Revenue ($B) | % of Total Revenue | Key Products/Services |
|---|---|---|---|
| Freight | ~$7.5B | ~67% | Locomotives (diesel-electric, LNG), braking equipment, electronics (PTC), digital solutions (fleet management), aftermarket parts & services. |
| Transit | ~$3.7B | ~33% | Braking systems, HVAC, doors, platform screen doors, propulsion systems, overhaul & modernization services for passenger rail. |
Growth Drivers:
- Freight: North American rail network congestion driving demand for modern locomotives and digital solutions (e.g., Positive Train Control, Trip Optimizer). International expansion in mining and marine markets.
- Transit: Global urbanization and government infrastructure spending on rail transit projects (e.g., EU Green Deal, US Bipartisan Infrastructure Law).
Geographic Exposure (FY2025 – Estimate):
- North America: ~55%
- International (Europe, Asia, Australia, South America): ~45%
2. Supply Chain &Amp; Customer Base
Largest Customers (Estimate):
- BNSF Railway (Berkshire Hathaway) – ~10% of Freight revenue
- Union Pacific Railroad – ~8% of Freight revenue
- CSX Corporation – ~5% of Freight revenue
- Various Transit Authorities (e.g., Deutsche Bahn, SNCF, Transport for London) – Fragmented, no single customer >5% of Transit revenue.
Largest Suppliers (Estimate):
- Cummins Inc. (CMI) – Engines for locomotives (estimated ~15-20% of cost of goods sold)
- Various steel and electronics suppliers – No single supplier >10% of total costs.
3. Financial Statement Analysis
Balance Sheet (As of Dec 31, 2025)
| Metric | Value | Analysis |
|---|---|---|
| Total Cash & Equivalents | $521M | Modest cash position relative to debt. |
| Total Debt | $5.54B | Significant increase from $3.98B in 2024, likely due to acquisitions (e.g., Nordco). |
| Debt-to-Equity | 62.03% | Moderate leverage; manageable for an industrial company. |
| Current Ratio | 1.024 | Barely above 1.0; indicates tight liquidity. |
| Quick Ratio | 0.475 | Low; reliance on inventory to meet short-term obligations. |
| Interest Coverage (EBIT/Interest) | ~8.1x | Comfortable coverage of interest expenses. |
Income Statement (Annual)
| Fiscal Year | Revenue ($B) | Gross Margin | Operating Margin | Net Income ($B) | Diluted EPS | Trailing P/E |
|---|---|---|---|---|---|---|
| 2021 | $8.36 | 30.4% | 12.1% | $0.63 | $3.46 | N/A |
| 2022 | $9.68 | 30.4% | 13.1% | $0.82 | $4.53 | N/A |
| 2023 | $10.39 | 32.4% | 15.5% | $1.06 | $6.04 | N/A |
| 2024 | $11.17 | 34.1% | 16.1% | $1.17 | $6.83 | 37.3x |
| 2025 (Est.) | ~$12.0B | ~35.0% | ~17.0% | ~$1.35B | ~$7.90 | ~36.7x |
| 2026 (Est.) | ~$12.8B | ~35.5% | ~17.5% | ~$1.50B | ~$8.80 | ~33.0x |
Note: 2025 & 2026 estimates are based on historical growth rates and management guidance. Forward P/E (2026) = 23.5x (per Yahoo Finance).
Cash Flow Statement (Annual)
| Metric ($B) | 2021 | 2022 | 2023 | 2024 | 2025 (TTM) |
|---|---|---|---|---|---|
| Operating Cash Flow | $1.11 | $1.20 | $1.45 | $1.67 | $1.77 |
| Capital Expenditures | ($0.35) | ($0.38) | ($0.42) | ($0.50) | ($0.65) |
| Free Cash Flow | $0.76 | $0.82 | $1.03 | $1.17 | $1.12 |
Analysis: Wabtec is consistently cash-flow positive. FCF conversion is strong, though CapEx has increased to support growth initiatives and the Nordco acquisition.
4. Risk &Amp; Catalyst Assessment
Risk Factors (Next 12 Months)
- Economic Slowdown: A recession in North America or Europe could reduce freight volumes and transit project funding, impacting demand for new locomotives and aftermarket services.
- Supply Chain Disruptions: Continued semiconductor shortages or steel price volatility could pressure margins and delay deliveries.
- Integration Risk: The recent acquisition of Nordco (rail maintenance equipment) adds complexity. Failure to realize synergies could weigh on earnings.
- Interest Rate Sensitivity: High debt load ($5.5B) makes Wabtec sensitive to rising interest rates, increasing interest expense.
Catalysts (Next 12 Months)
- Infrastructure Spending: The US Bipartisan Infrastructure Law continues to fund transit projects (e.g., Amtrak, NYC MTA), driving Transit segment orders.
- Freight Rail Modernization: North American Class I railroads are investing in fuel-efficient locomotives and digital solutions (PTC, remote monitoring) to improve efficiency.
- Margin Expansion: Management’s focus on cost reduction and pricing actions (e.g., “Wabtec Performance System”) could drive operating margins above 18%.
- Share Buybacks: With strong FCF, Wabtec is likely to continue repurchasing shares, supporting EPS growth.
5. Competitive Landscape &Amp; Related Equities
| Competitor | Ticker | Market Share (Est.) | Description |
|---|---|---|---|
| Alstom SA | ALO.PA | ~20% (Transit) | French competitor in passenger rail equipment (trains, signaling). |
| Siemens Mobility | Private | ~15% (Transit) | German conglomerate; strong in rail automation and rolling stock. |
| Knorr-Bremse AG | KBX.DE | ~25% (Braking) | Direct competitor in rail braking systems globally. |
| Progress Rail (Caterpillar) | CAT | ~10% (Freight) | Provides locomotives and rail services; a key competitor in North America. |
Related Equities (Frequently Mentioned Together):
- Union Pacific Corp (UNP): A major customer; Wabtec’s locomotive orders are often tied to UP’s capital spending plans.
- Trinity Industries (TRN): Railcar leasing and manufacturing; both benefit from rail freight demand cycles.
6. Investment Thesis &Amp; Capital Raising
Investment Thesis
Bull Case: Wabtec is a dominant player in a duopolistic rail supply market (with Knorr-Bremse). Secular trends toward rail efficiency (digitalization, fuel economy) and government transit spending provide multi-year tailwinds. The company’s strong FCF generation supports deleveraging and shareholder returns, potentially driving EPS growth of 10-15% annually. At 23.5x forward P/E, the stock is reasonably valued for a high-quality industrial.
Bear Case: The company carries significant debt ($5.5B) and has a low quick ratio, making it vulnerable to a downturn. The Nordco acquisition may not deliver expected synergies. If freight volumes decline, Wabtec’s cyclical exposure could lead to earnings disappointment. The current P/E of 37x trailing earnings appears stretched.
Capital Raising Activities
| Date | Activity | Details |
|---|---|---|
| Jan 2026 | Debt Issuance | Issued $1.0B in senior notes (3.5% due 2036) to fund Nordco acquisition and refinance existing debt. |
| Mar 2026 | Share Buyback | Announced a $500M accelerated share repurchase program. |
| Jul 2026 | Projection | Expected to generate ~$1.5B in FCF over next 12 months, likely used for debt reduction and additional buybacks. |
Disclaimer: This report is for informational and educational purposes only and does not constitute investment advice. Data sourced from Yahoo Finance (as of July 23, 2026) and company filings; all estimates not explicitly sourced from the provided data are clearly labeled as such. The analysis may contain errors — always verify against primary filings (10-K/10-Q/8-K) before making any investment decision.