 Andrew@CANSLIM RESEARCH
If you’ve felt like the stock market is getting harder to trade lately, you’re not imagining things. Behind the surface numbers, market momentum has weakened significantly. While a few giant tech stocks are keeping major indexes afloat, the broader market is quietly breaking down under the weight of surging oil prices and rising Treasury yields. Here is a simple breakdown of what’s happening beneath the surface—and why long-term buyers need to exercise extreme caution right now.
The Macro Drag: High Yields & Oil Prices
The two biggest headwinds driving market weakness right now are spiking oil prices and rising 10-year Treasury yields. When borrowing costs stay high for longer, certain types of stocks suffer the most:
- High-Beta (High Volatility) Stocks: Highly sensitive to market pullbacks.
- Debt-Heavy Companies: Refinancing debt at current interest rates is becoming painfully expensive.
- Negative Cash-Flow Businesses: Companies that burn cash (like TEM) may soon be forced to raise capital by issuing high-cost debt or selling discounted shares—both of which crush stock prices.
⚠️ Key Takeaway: The market is already pricing in a cautious outlook ahead of upcoming PPI (Thursday) and CPI (Friday) inflation reports.
Market Breadth: The Warning Light is Flashing
Market breadth measures how many individual stocks are participating in a rally. Right now, breadth is dropping fast:
- The number of stocks trading above their 20-day, 50-day, and 200-day moving averages is collapsing across both the SPY and NASDAQ.

- Broad market ETFs like IWM (Small Caps), IWR (Mid Caps), RUT, and QQQE (Equal-Weight Nasdaq) have all fallen below their key 50-day moving averages.
- Stockbee’s T2108 indicator (measuring stocks above their 40-day average) has plunged to a recent low of 36.41.

Why does QQQ still look okay?
The standard QQQ index is market-cap weighted. A handful of mega-cap AI chip and storage hardware stocks are holding the entire index up, masking widespread weakness across the rest of the market.
Sector Rotation: Following the Smart Money
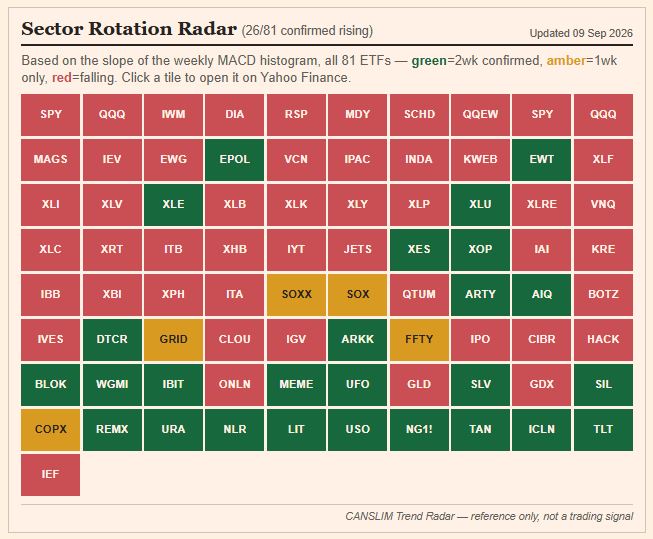
Not all sectors are created equal. By tracking weekly momentum (MACD Histogram Slopes), we can see a clear split in where capital is flowing:

| 🟢 Money Flowing IN | 🔴 Money Flowing OUT |
| AI Chips & Storage Hardware | Software |
| Nuclear & Solar Energy | Cybersecurity |
| Oil & Gas | Biotech & Healthcare |
| Rare Earth Metals |
(Note: Defensive sectors like energy and metals can bounce, but they rarely have the horsepower to carry the broader U.S. stock market to new highs on their own.)
The Playbook: What Should You Do Now?
In market conditions like these, forcing long-term positions usually leads to unnecessary losses. Here is how to adapt:
- Avoid Opening Long-Term Long Positions: The broader tide is against you. Wait for market breadth to stabilize before building core positions.
- Shorten Your Timeframe: If you choose to trade, keep duration tight. Focus on short swing trades or day trades (1-day execution windows).
- Respect Cash Flow: Stay away from unprofitable, high-debt growth companies until interest rate pressures cool down.
- Protect Capital First: Cash is a valid position during market corrections.
Discover more from CANSLIM Research
Subscribe to get the latest posts sent to your email.