 Andrew@CANSLIM RESEARCH
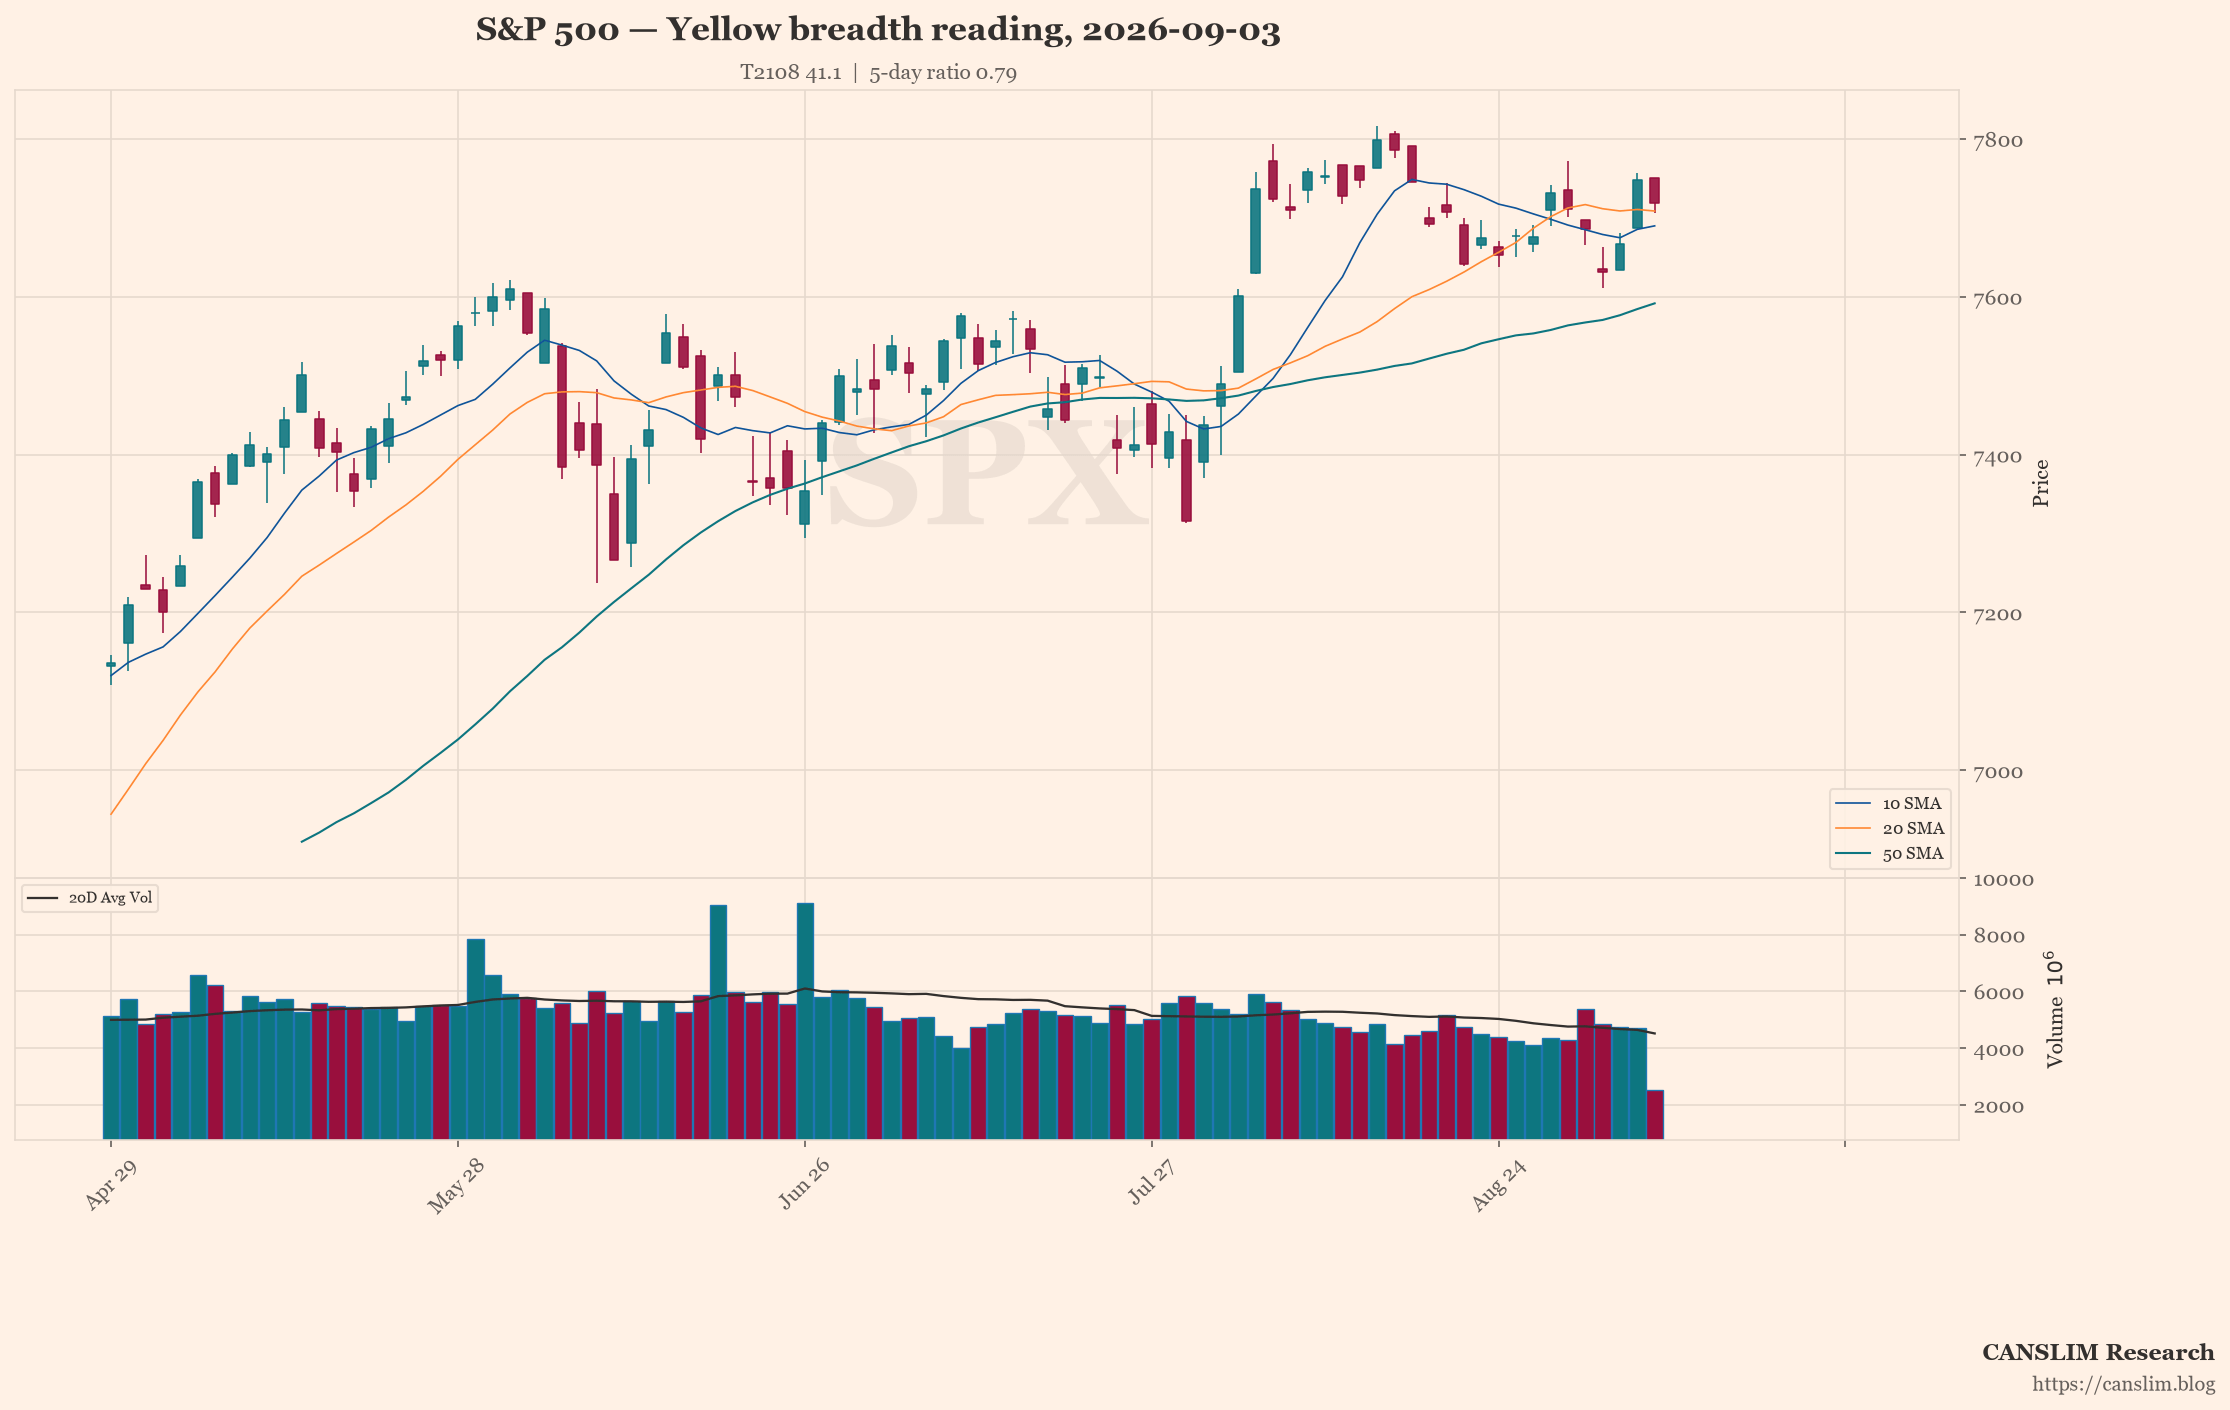
The S&P 500 has slipped just 0.7% over the past three weeks, yet the percentage of stocks trading above their 50-day moving average has fallen sharply from 55.0 to 41.1. This divergence between index resilience and underlying weakness is now the central tension in the tape.
The Story So Far
The picture began to change in mid-August, when T2108 first slipped below the 50 threshold on August 18, even as the index hovered near its highs. The sellers took firmer control on August 28, when the 5-day up/down volume ratio first fell below 1.0, and T2108 broke under 40 three sessions later on August 31. Since then, the ratio has remained below parity — 0.66 on September 1, 0.81 on September 2, and 0.79 today — even as the S&P 500 staged a partial recovery to 7,747.71.
Reading Today’s Signals
Today’s 4% mover count of 251 advancers versus 112 decliners is constructive on the surface, but the 5-day ratio of 0.79 remains in the neutral band of 0.5–1.5, indicating sellers have not relinquished control. T2108 at 41.1 sits within the normal 30–70 range, though it is closer to the lower boundary than the upper. No historical match was found in the loaded data for a comparable T2108 reading at this index level; the nearest prior session was June 22, when T2108 stood at 44.1 with the S&P at 7,472.79.
Divergence Check
The index and breadth are diverging: the S&P 500 has recovered from its September 1 low, but T2108 has not confirmed that move, remaining below 42. This suggests the recent index strength is not broadly supported and may be vulnerable to reversal.
Recent Trend
| Date | S&P 500 | T2108 | 5-day ratio | Up4% / Down4% |
|---|---|---|---|---|
| 09/03 | 7,747.71 | 41.1 | 0.79 | 251 / 112 |
| 09/02 | 7,666.60 | 39.1 | 0.81 | 290 / 96 |
| 09/01 | 7,631.47 | 36.4 | 0.66 | 114 / 356 |
| 08/31 | 7,686.14 | 39.2 | 1.05 | 132 / 158 |
| 08/28 | 7,711.23 | 41.9 | 0.98 | 84 / 382 |
| 08/27 | 7,728.65 | 45.2 | 1.76 | 298 / 145 |
| 08/26 | 7,676.31 | 45.1 | 1.31 | 155 / 138 |
| 08/25 | 7,676.62 | 45.8 | 1.69 | 293 / 93 |
| 08/24 | 7,652.86 | 45.9 | 1.21 | 142 / 238 |
| 08/21 | 7,674.37 | 45.7 | 1.18 | 332 / 79 |
| 08/20 | 7,641.16 | 45.0 | 1.04 | 146 / 269 |
| 08/19 | 7,707.98 | 48.5 | 1.31 | 556 / 190 |
| 08/18 | 7,691.76 | 47.9 | 1.10 | 167 / 335 |
| 08/17 | 7,745.06 | 51.2 | 1.37 | 194 / 305 |
| 08/14 | 7,785.76 | 54.5 | 1.55 | 234 / 147 |
| 08/13 | 7,798.99 | 55.0 | 1.83 | 345 / 167 |
Desk Verdict
Yellow. The verdict is Yellow because the 5-day ratio of 0.79 falls within the neutral 0.5–1.5 band, T2108 at 41.1 is inside the normal 30–70 range, and quarterly breadth is roughly balanced at 1,385 advancers versus 1,094 decliners. None of these metrics has reached an extreme that would warrant a green or red signal.
Stage, pattern and sentiment labels are generated by rule-based approximations (Weinstein stage analysis, Minervini trend template and heuristic pattern detection), not by precise technical analysis. Data as of September 05, 2026. For informational and educational purposes only — not investment advice. Always verify against primary sources before making any investment decision. This analysis draws on Pradeep Bonde’s Stockbee Market Monitor framework and CANSLIM Research’s daily data. It describes current market conditions and is not personalized investment advice.
Discover more from CANSLIM Research
Subscribe to get the latest posts sent to your email.


