 Andrew@CANSLIM RESEARCH
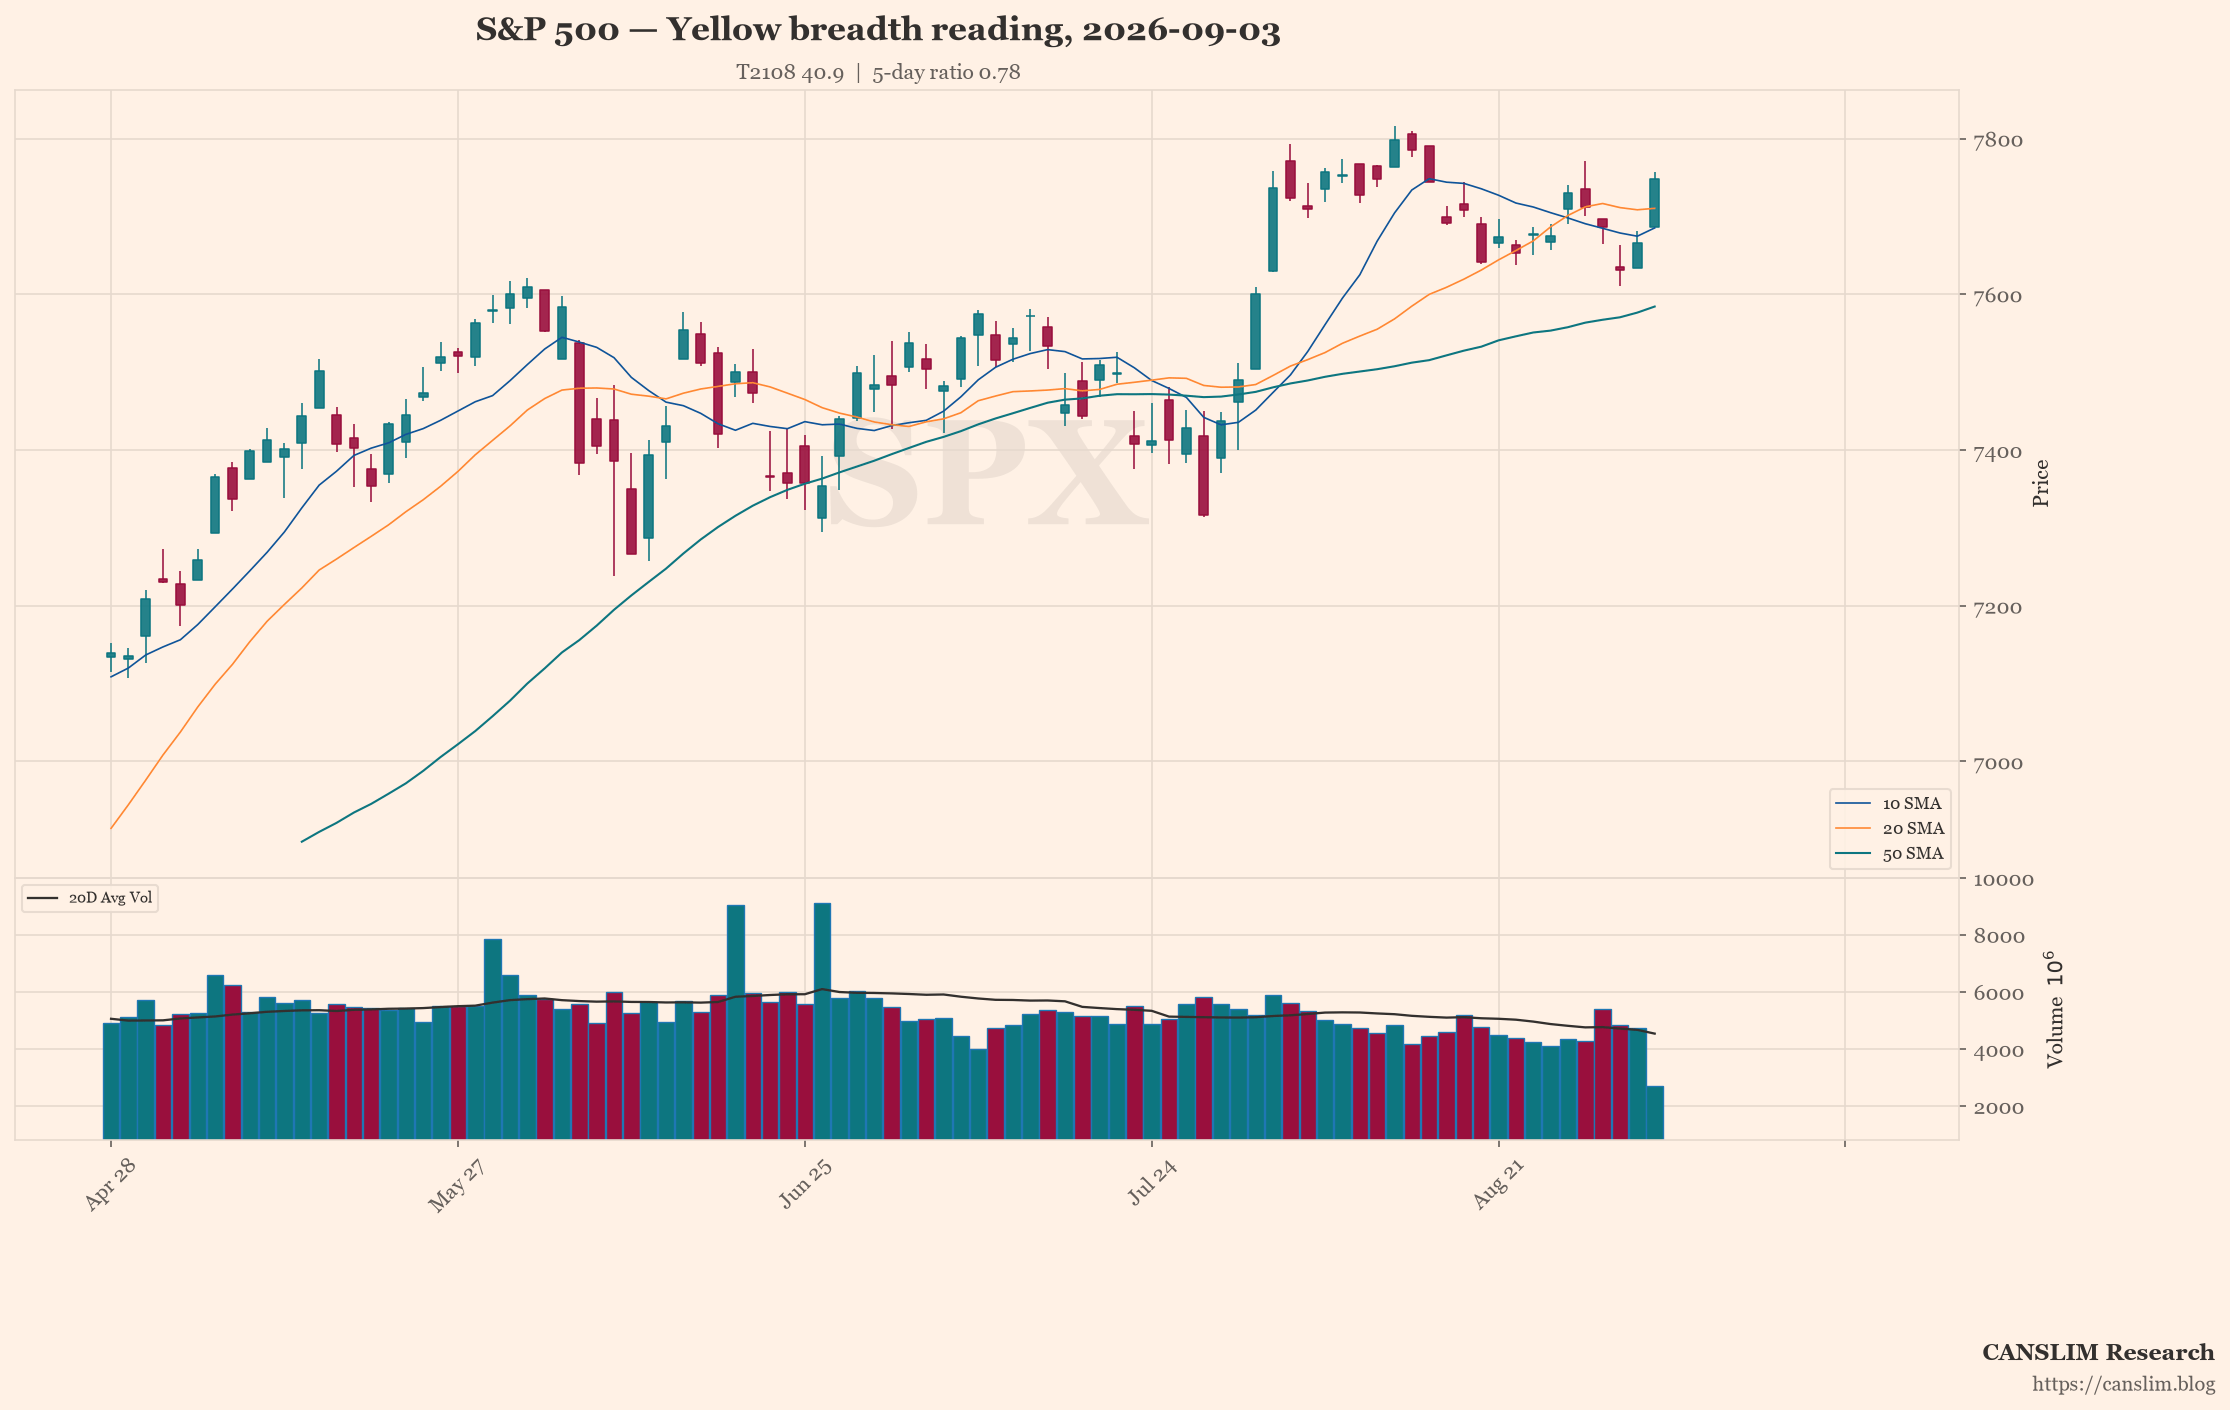
The S&P 500 has slipped just 0.7% over the past three weeks, yet the percentage of stocks trading above their 50-day moving average (T2108) has fallen by more than a quarter. This divergence suggests the index’s resilience is masking a broader loss of internal participation.
The Story So Far
The window opened on August 13 with the S&P 500 at 7,798.99 and T2108 at 55.0, supported by a 5-day ratio of 1.83. The first clear sign of strain came on August 18, when T2108 dipped below 50 to 47.9, even as the index remained within 1% of its starting level. Sellers took control of the 5-day ratio on August 28, when it fell below 1.0 to 0.98, and T2108 subsequently broke below 40 on August 31. By September 3, the index had recovered to 7,747.70, but T2108 sat at 40.9—a level last seen on June 17, when the S&P 500 was at 7,420.10.
Reading Today’s Signals
Today’s 4-count of 244 advancing stocks versus 110 declining is the strongest single-day breadth reading since August 25, but the 5-day ratio of 0.78 remains below 1.0, indicating that sellers have held the edge over the past week. The 10-day ratio of 1.16 shows that the longer window still favors buyers, while T2108 at 40.9 sits in the lower half of the normal 30–70 band. No historical match for the current T2108 level was found in the loaded data beyond the June 17 session, which itself occurred at a lower index price.
Divergence Check
The index and breadth are clearly diverging: the S&P 500 has fallen only 0.7% over the window, while T2108 has dropped 25.7%. This implies that the index’s relative stability is being carried by a narrowing set of large-cap names, leaving the broader market vulnerable to a sharper correction if leadership falters.
Recent Trend
| Date | S&P 500 | T2108 | 5-day ratio | Up4% / Down4% |
|---|---|---|---|---|
| 09/03 | 7,747.70 | 40.9 | 0.78 | 244 / 110 |
| 09/02 | 7,666.60 | 39.1 | 0.81 | 290 / 96 |
| 09/01 | 7,631.47 | 36.4 | 0.66 | 114 / 356 |
| 08/31 | 7,686.14 | 39.2 | 1.05 | 132 / 158 |
| 08/28 | 7,711.23 | 41.9 | 0.98 | 84 / 382 |
| 08/27 | 7,728.65 | 45.2 | 1.76 | 298 / 145 |
| 08/26 | 7,676.31 | 45.1 | 1.31 | 155 / 138 |
| 08/25 | 7,676.62 | 45.8 | 1.69 | 293 / 93 |
| 08/24 | 7,652.86 | 45.9 | 1.21 | 142 / 238 |
| 08/21 | 7,674.37 | 45.7 | 1.18 | 332 / 79 |
| 08/20 | 7,641.16 | 45.0 | 1.04 | 146 / 269 |
| 08/19 | 7,707.98 | 48.5 | 1.31 | 556 / 190 |
| 08/18 | 7,691.76 | 47.9 | 1.10 | 167 / 335 |
| 08/17 | 7,745.06 | 51.2 | 1.37 | 194 / 305 |
| 08/14 | 7,785.76 | 54.5 | 1.55 | 234 / 147 |
| 08/13 | 7,798.99 | 55.0 | 1.83 | 345 / 167 |
Desk Verdict
Yellow. The verdict is Yellow because the 5-day ratio of 0.78 falls within the neutral 0.5–1.5 band, T2108 at 40.9 remains inside the normal 30–70 range, and quarterly breadth is roughly balanced at 1,385 gainers versus 1,094 losers. These readings do not yet warrant a red signal, but the deteriorating trend in breadth over the past two weeks argues against a green.
Stage, pattern and sentiment labels are generated by rule-based approximations (Weinstein stage analysis, Minervini trend template and heuristic pattern detection), not by precise technical analysis. Data as of September 04, 2026. For informational and educational purposes only — not investment advice. Always verify against primary sources before making any investment decision. This analysis draws on Pradeep Bonde’s Stockbee Market Monitor framework and CANSLIM Research’s daily data. It describes current market conditions and is not personalized investment advice.
Discover more from CANSLIM Research
Subscribe to get the latest posts sent to your email.