 Eben@CANSLIM Research
Institutional Analysis & Market Backdrop
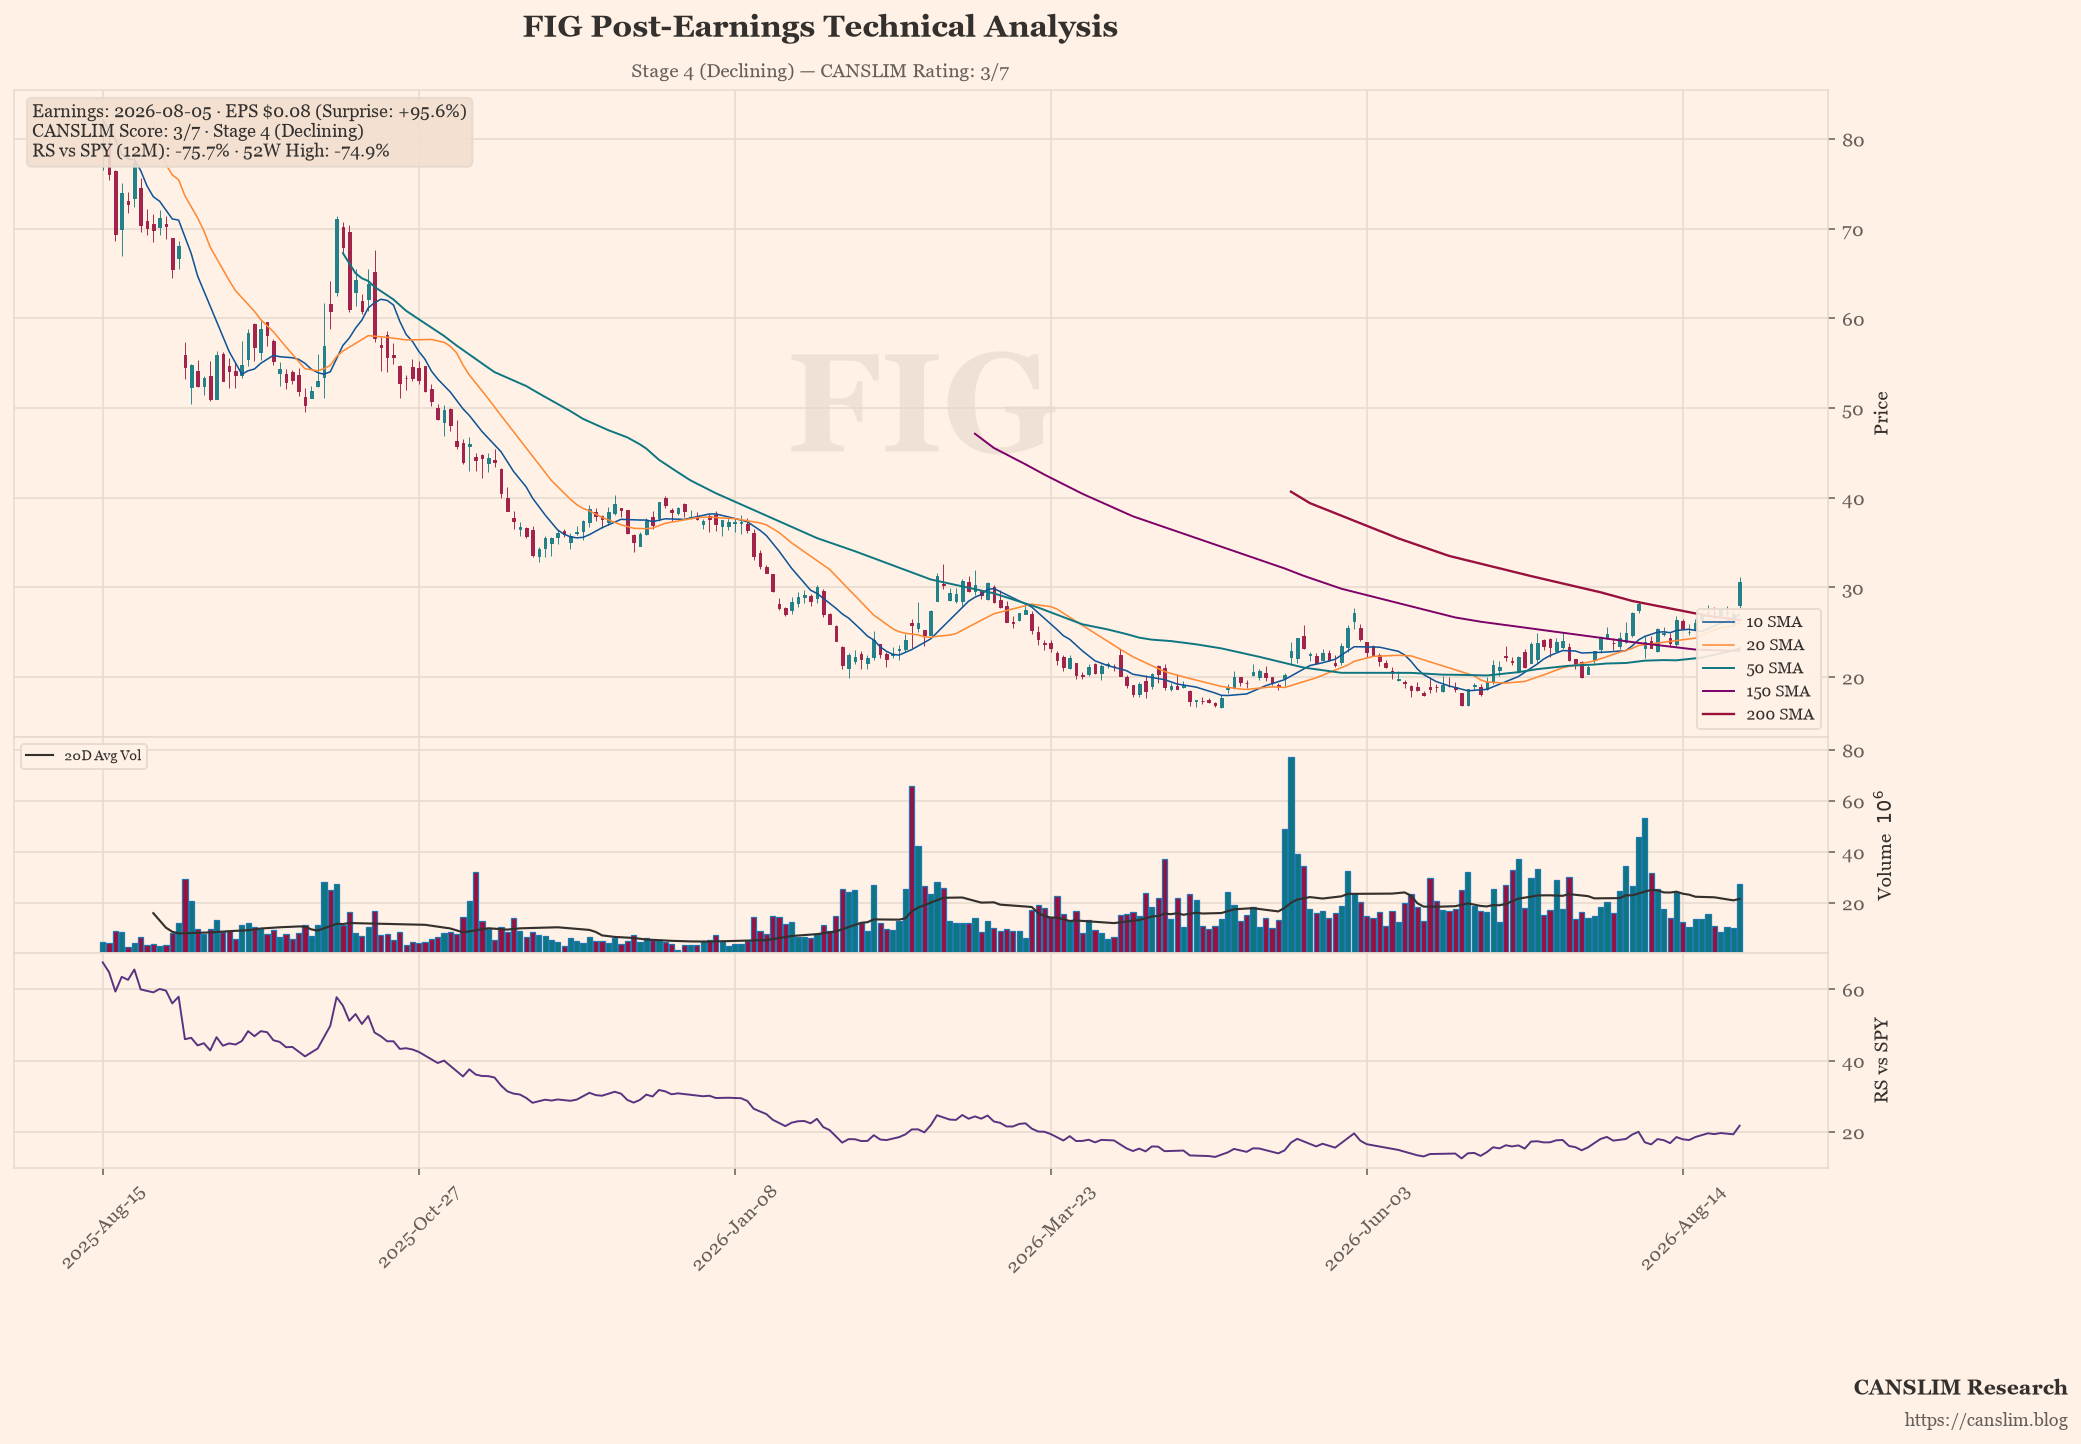
FIG has exceeded expectations with an EPS of 0.08 against a consensus of 0.04, representing a staggering 95.6% surprise that underscores the resilience of its cloud infrastructure business. Revenue growth of 48.2% year-on-year confirms that despite macro headwinds, demand for AI-driven computing services remains robust, validating the company’s strategic pivot towards high-margin enterprise solutions.
Technically, FIG is currently in Stage 4 (Declining), trading at $30.62 with a -74.9% drawdown from its recent highs. While the share price has failed to reclaim key moving average support levels at $23.22 (MA50) and $26.38 (MA200), the massive earnings beat suggests institutional accumulation may be occurring below the surface, though the immediate technical structure remains bearish.
Looking forward, investors should monitor whether this earnings surprise can catalyse a reversal from the current downtrend or if further downside is required to establish a new base. The CANSLIM score of 3/7 indicates limited momentum support, with volume and price action currently lagging behind the fundamental performance. Operational risks include potential margin compression as the company scales its data centre footprint, but the long-term thesis remains intact pending a technical re-rating.
Earnings & Quantitative Scorecard
| Key Metric | Reported / Current | Benchmark / Consensus | Status |
|---|---|---|---|
| Quarterly EPS (C) | $0.08 (+-11% YoY) | $0.04 (Surprise: +95.6%) | Fail |
| Quarterly Revenue | $370.1M (+48.2% YoY) | Top-line Growth | Pass |
| Annual EPS Growth (A) | N/A | ≥25% Annual CAGR | Fail |
| 52-Week High Range (N) | -74.9% off high | Within 15% of High | Lagging |
| Relative Strength (L) | -75.7% vs SPY | Positive Alpha | Fail |
| Institutional Float (I) | 88% | 30% – 90% Float Ownership | Pass |
| Minervini Trend Template | 3 / 7 Criteria | Stage 2 Uptrend Alignment | Stage 4 (Declining) |
| Composite CANSLIM Rating | 3 / 7 Pillars | Institutional Quality Setup | 🔴 Lagging / Deteriorating |
Stage, pattern and sentiment labels are generated by rule-based approximations (Weinstein stage analysis, Minervini trend template and heuristic pattern detection), not by precise technical analysis. Data as of August 30, 2026. For informational and educational purposes only — not investment advice. Always verify against primary sources before making any investment decision.
Discover more from CANSLIM Research
Subscribe to get the latest posts sent to your email.