 Andrew@CANSLIM RESEARCH
The Tape Holds Firm, But the Foundation Is Thinning
The US stock market is not cracking, but it is getting more selective. The S&P 500 sits near record highs, yet Monday’s session closed softer. The Dow fell 0.5%, and the Nasdaq declined 0.3%. Overnight, futures weakened further. SPY dropped to 770.32, down 0.95%. QQQ slid 1.38%. The culprit is a familiar one: rising energy prices and surging bond yields. A ship attack in the Strait of Hormuz and stalled US-Iran talks have pushed Brent crude toward $100. That spike feeds directly into inflation expectations. It also pressures bond prices. The 30-year Treasury yield has climbed to 5.31%, its highest level since 2007. This is a dangerous mix for growth stocks. Higher yields discount future earnings more heavily. The market is holding up, but the leadership is narrow and increasingly dependent on a few pockets of strength.
The Bond Market Is the Real Master Now
The highest-information commentary from the online crowd focuses on rates. The 30-year at 5.31% and the 10-year near 4.8% are not just numbers. They are a regime change. One user noted, “There are absolutely no buyers for bonds—that is what should scare you.” Weak Japanese GDP data added fuel. The 10-year JGB yield hit a 30-year high of 2.925%. Market pricing for a September BOJ rate hike jumped from 30% to 60%. This revives fears of carry-trade unwinding. If Japan raises rates, Japanese investors may sell US Treasuries. That would push yields even higher. A break below 80 in TLT is viewed as a landmark event. For growth investors, this is the key risk. The bond market is dictating the tape, not earnings.
Memory Stocks Show a V-Shaped Reversal
The overnight session saw a wild ride in memory and AI names. South Korea’s KOSPI plunged after opening higher. SK Hynix and Samsung rose 5% to 7% early, then gave back gains. US memory stocks reversed in tandem. SNDK fell from 1801 to 1718, down 1.19%. MU dropped from 1025 to 987, down 1.80%. WDC fell 2.54%. AMD dropped 4.62%. NBIS fell 6.62%. The online crowd blamed South Korean leveraged positions exiting. But a louder opposing view emerged. Some users pointed out the KOSPI actually opened higher. They argued the real selling came from US algorithmic trading and oil prices. The truth is likely a chain reaction. South Korean profit-taking triggered stop-losses and margin calls. That cascaded into US markets. The volatility is a warning. Leverage is high, and the crowd is panicking over small moves.
The Online Crowd’s Panic Is Overstated
Global social sentiment is fearful, but not out of control. The Fear/Greed level sits near 40 out of 100. This is “leverage panic,” not “valuation panic.” Many users admit to using 10x leverage or being fully invested in options. An index decline of less than 1% was enough to trigger talk of “liquidating everything.” The narrative was severely exaggerated. Comments described a “crash” and “circuit breakers.” In reality, SPY was down less than 1% and had merely returned to its level from six trading days earlier. The real declines were concentrated in a handful of names. META, RDDT, NBIS, and AMD led the downside. At the index level, this is typical volatility near highs. More rational warnings gained traction. One highly upvoted comment noted that the collective excitement over a -0.2% decline was itself evidence of excessive leverage. The urge to buy the dip remains strong. Underlying greed has not been flushed out.
META’s Trial Adds Single-Stock Tail Risk
META is the weakest mega-cap stock overnight, trading at 565.51, down 4.31%. The catalyst is a child social media addiction trial. California, Colorado, Kentucky, and New Jersey seek penalties as high as $1.4 trillion. The judge has called that figure “unreasonable.” Opening statements begin Tuesday, and the trial may last 6 to 8 weeks. Retail traders are heavily concentrated in META and METU. They are publicly asking for help. Rational responses dominate. The damages will likely be reduced substantially and paid over an extended period. But the case remains a long-term valuation overhang. It is inadvisable to hold through the opening statements. This is a single-stock tail risk. It is not a market-wide issue. But it adds to the selective nature of this tape.
The Nasdaq’s Chart Is the Weakest Link
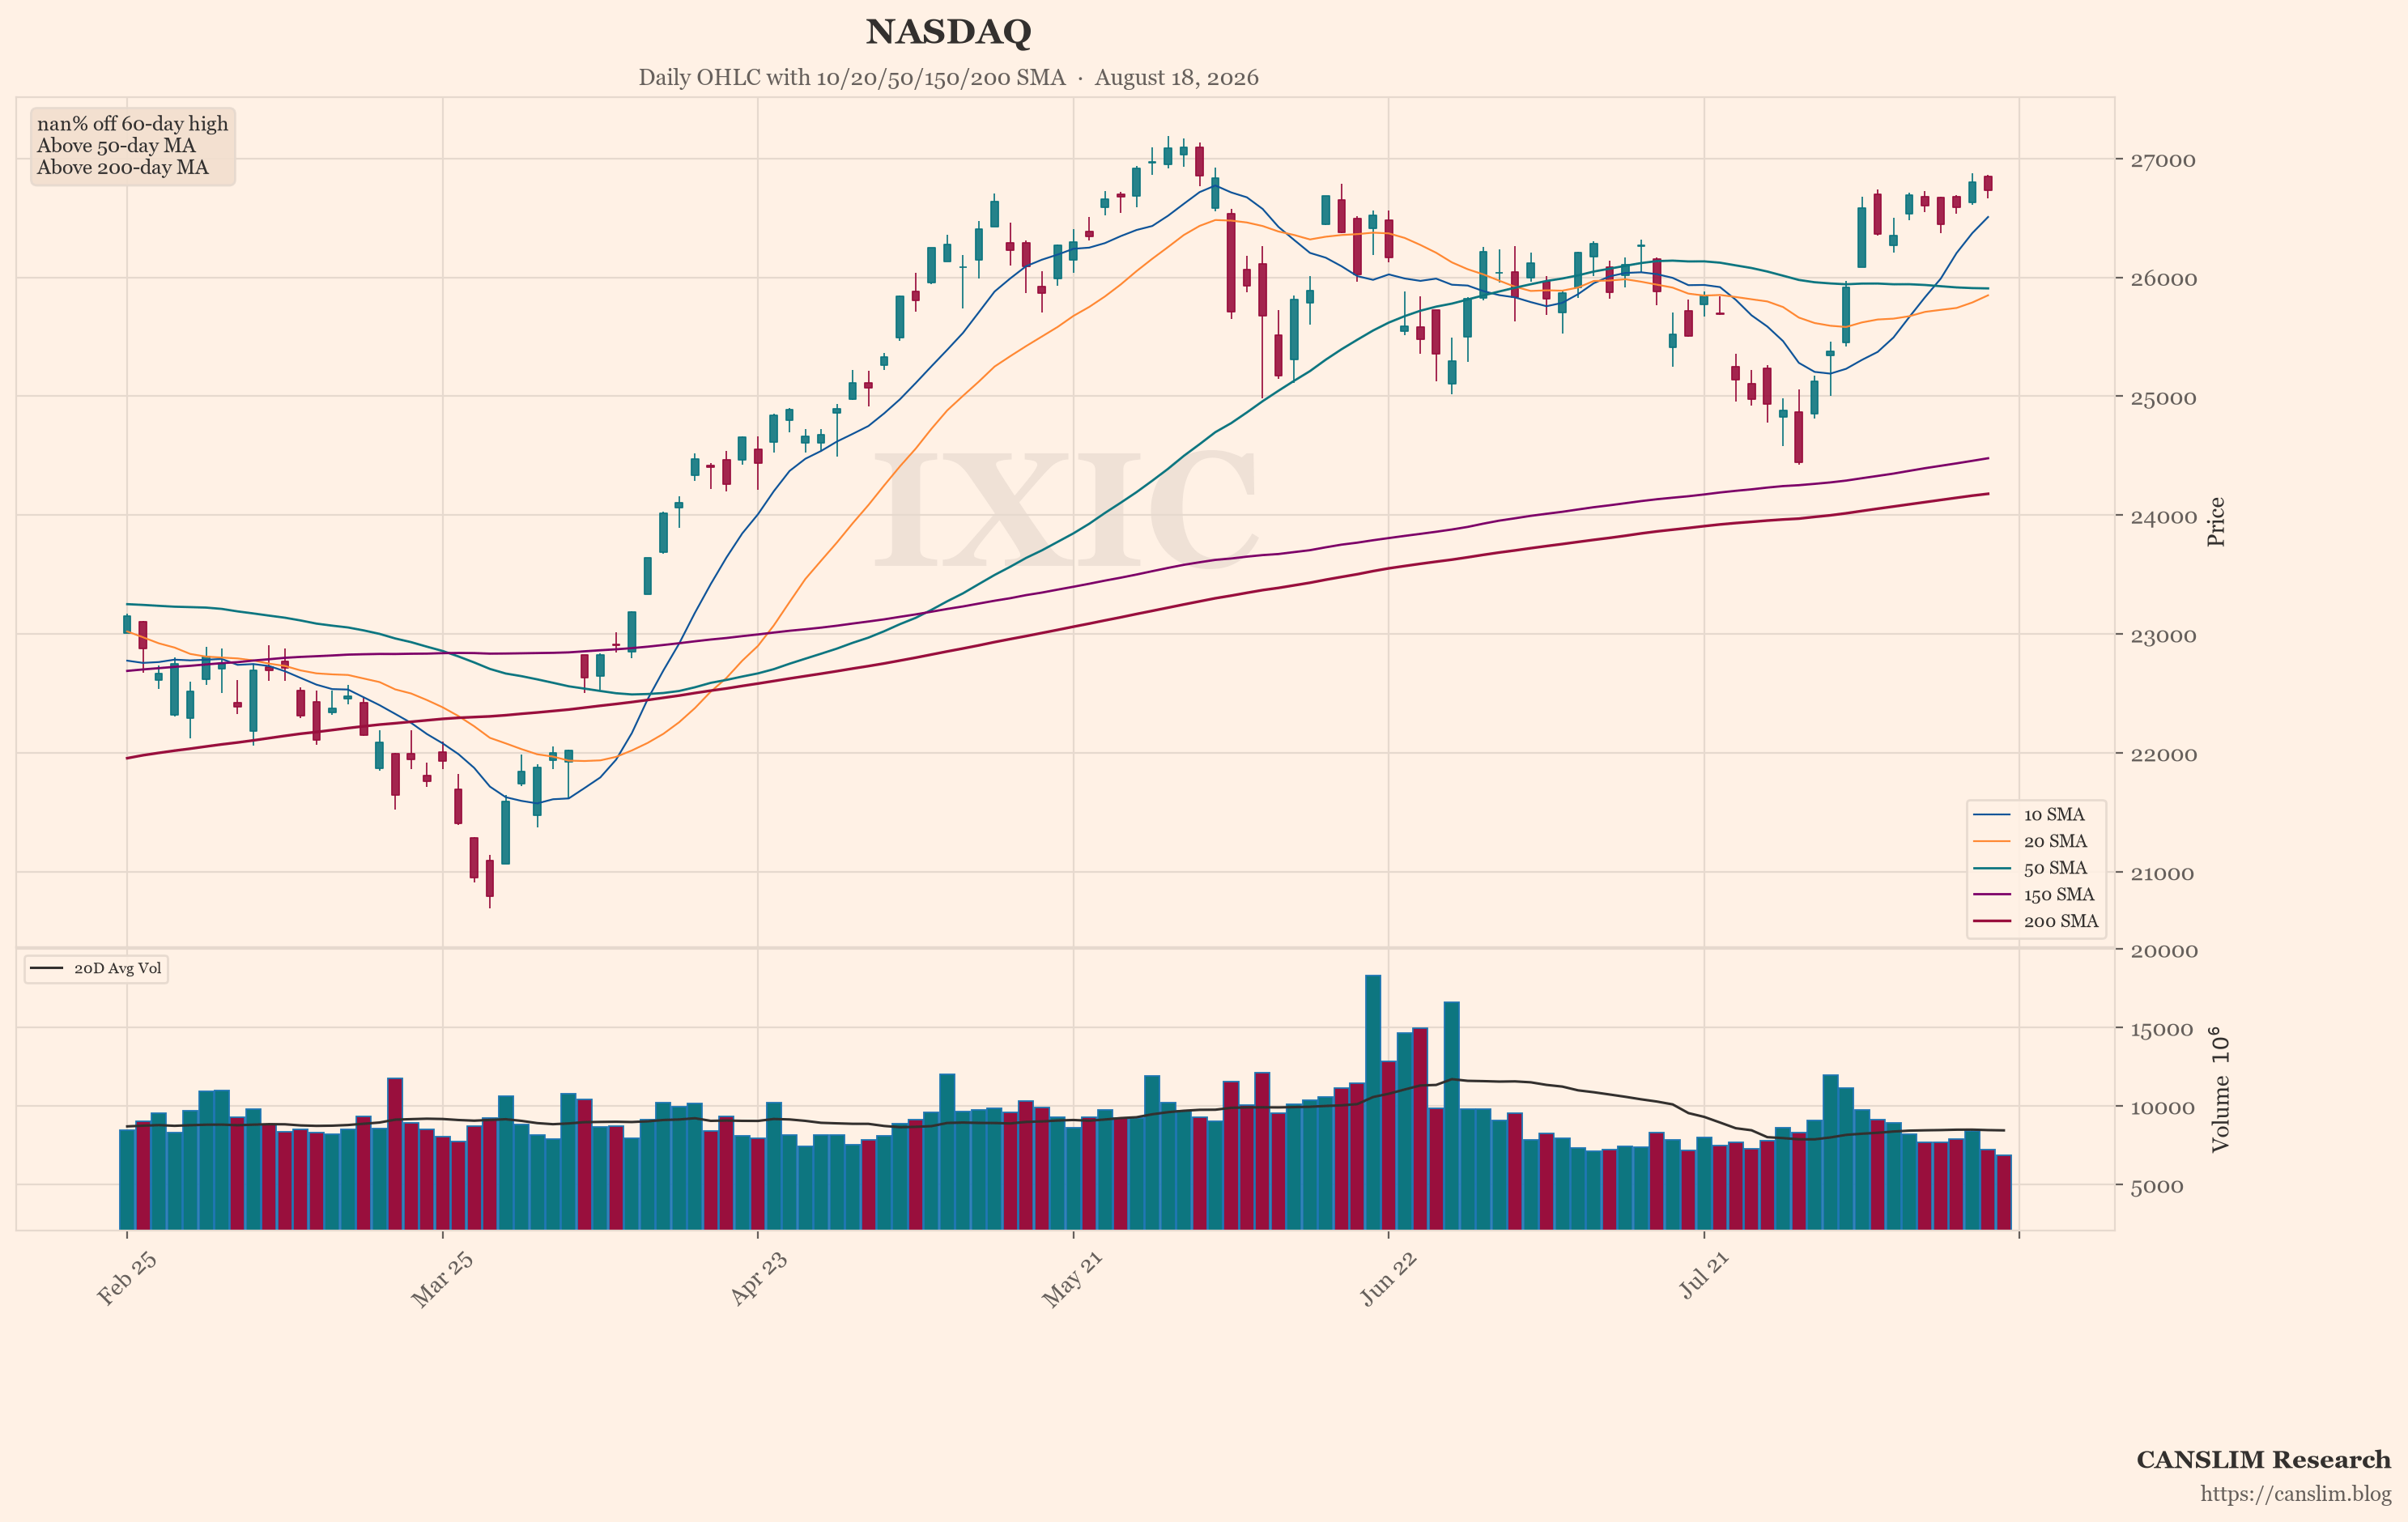
The featured chart is the Nasdaq (^IXIC). It currently shows the weakest technical pattern among major indexes. The S&P 500 is at record highs. The Dow is holding up. But the Nasdaq is lagging. This is a sign of narrowing breadth. The market is increasingly dependent on a few growth pockets. AI and memory names are still attracting money. But they are also the most volatile. The online crowd’s panic is concentrated in these names. The Nasdaq’s weakness reflects this. It is not a crash. It is a rotation. Money is moving away from rate-sensitive, high-multiple stocks. It is moving toward energy and value. Until bond yields stabilize, the Nasdaq will likely remain the weakest link. Watch the 30-year yield. If it breaks higher, expect more pressure on tech.
The Next Leg Depends on Earnings and the Fed
The market is at a crossroads. Oil and yields are pulling in one direction. Earnings and momentum are pulling in the other. Retail earnings and FOMC minutes are on deck. They will either validate resilience or expose softness in demand. The online crowd is watching closely. The fear is that higher oil feeds into higher yields. That raises the pressure on stock valuations. The hope is that growth stays firm enough to offset the drag. The S&P 500 reaching record highs shows the bull trend is intact. But the tape is choppier. The leadership is narrow. The Nasdaq is weak. The next leg depends on whether earnings can carry equities while rates move against them. If yields keep climbing, the market will get more selective. If earnings surprise to the upside, the bulls can hold the line. Stay disciplined. Focus on quality. Avoid leverage. The market is not cracking, but it is testing your patience.
Sources: market news brief & global social sentiment data. Updated 2026-08-18 14:00 HKT. For educational purposes only — not investment advice.
Discover more from CANSLIM Research
Subscribe to get the latest posts sent to your email.