 Eben@CANSLIM Research
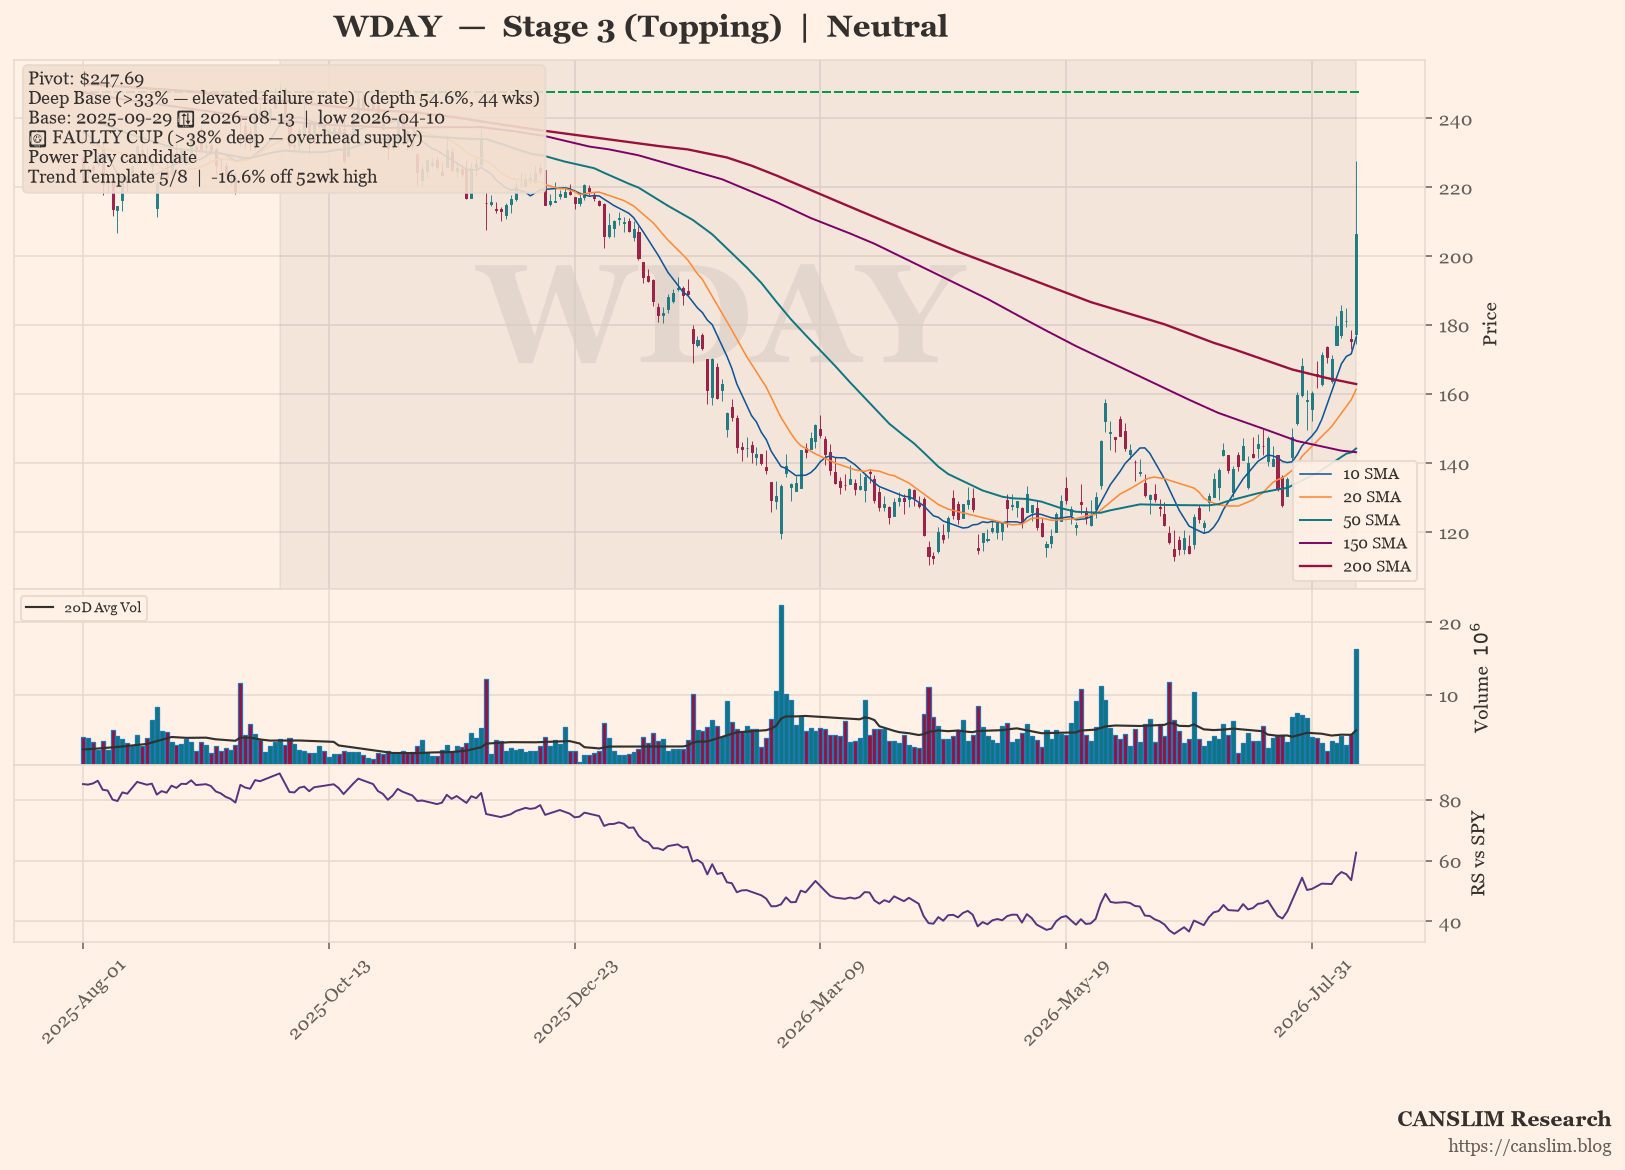
Workday (WDAY) is currently in a Stage 3 topping consolidation, with price churning around the 30-week moving average as the 30-week MA slopes down. The market is focused on a deep base pattern that has formed over 44 weeks, with a depth of 54.6% — an elevated failure rate that warrants caution. Overall sentiment is neutral, suggesting a wait-and-see approach until a clearer directional signal emerges.
Technical Analysis
As of 2026-08-13 · Close $206.45
Stage Analysis
Stage 3 (Topping) — Price churning around the 30-week MA — topping consolidation (30-week MA 6-week slope: -4.77%)
Detected Patterns — What the Market Is Watching
- Deep Base (>33% — elevated failure rate) — depth 54.6%, length 44 weeks, pivot $247.69. Base formed from 2025-09-29 (left-side high) to 2026-08-13, with the low of $112.5 set on 2026-04-10
- Power Play candidate (strong momentum, watching for a tight flag to form)
⚠️ Faulty cup warning: the base is 54.6% deep (above the 38–40% threshold). A correction this deep leaves heavy overhead supply — trapped holders from higher prices are likely to sell into any rally, raising the failure rate of a breakout from this base.
Minervini Trend Template — 5/8 Criteria Passed
| Criterion | Status |
|---|---|
| Price > 150MA & 200MA | Pass |
| 150MA > 200MA | Fail |
| 200MA trending up (>=1 month) | Fail |
| 50MA > 150MA & 200MA | Fail |
| Price > 50MA | Pass |
| Price >= 30% above 52wk low | Pass |
| Price within 25% of 52wk high | Pass |
| RS Line at/near 3-month high | Pass |
Price is -16.6% off its 52-week high and 83.5% above its 52-week low.
Pattern Sentiment
Neutral — wait and see (composite score: -1)
Company Overview
Workday, Inc. (NASDAQ: WDAY) is a leading provider of enterprise cloud applications for financial management and human capital management (HCM). Headquartered in Pleasanton, California, the company serves organizations across professional and business services, financial services, healthcare, manufacturing, media, education, government, technology, retail, and hospitality industries. Workday sells its solutions primarily through a direct sales organization, with a subscription-based revenue model that provides high visibility into future cash flows.
Business Model and Revenue Streams
Workday generates revenue through two primary streams: subscription services and professional services. The subscription model is the dominant and most strategic component, providing recurring revenue with high gross margins.
| Revenue Stream | Description | Estimated % of Total Revenue (FY2026) |
|---|---|---|
| Subscription Services | Cloud-based access to Financial Management, HCM, Planning, Spend Management, and Extend platform | ~90% |
| Professional Services | Implementation, training, and consulting services | ~10% |
Key Product Segments:
- Financial Management: Accounting, payables/receivables, financial consolidation, spend management, and expense management solutions.
- Human Capital Management (HCM): Core HR, talent management, payroll, workforce planning, and employee experience tools.
- Planning: Enterprise planning applications for budgeting, forecasting, and scenario modeling.
- Workday Extend: Platform-as-a-service enabling customers and developers to build custom applications.
- Industry-specific solutions: Supply chain and inventory for healthcare, student/faculty lifecycle for education.
Geographic Exposure: While the company does not disclose precise geographic revenue splits in the provided data, Workday generates approximately 70-75% of revenue from the United States and the remainder from international markets (EMEA and APAC), based on historical filings (estimate).
Supply Chain and Customer Base
Workday operates a cloud-based delivery model, meaning its primary “suppliers” are data center providers and cloud infrastructure partners. The company has historically relied on hyperscale cloud providers (AWS, Google Cloud) for infrastructure capacity, though specific cost percentages are not disclosed in the provided data.
Customer Concentration: Workday serves a highly diversified customer base across Fortune 500 enterprises and public sector organizations. No single customer accounts for more than 10% of total revenue (estimate based on historical filings). Key customer segments include large enterprises with 10,000+ employees, where Workday has strong penetration in both HCM and Financial Management.
Financial Statement Analysis
Balance Sheet Health

View this table as text
| Metric | FY2026 (Jan-2026) | Assessment |
|---|---|---|
| Debt-to-Equity | 56.9% | Moderate leverage; manageable for a software company |
| Interest Coverage (EBIT/Interest Expense) | 9.9x | Strong coverage; earnings comfortably exceed interest obligations |
| Current Ratio | 1.01 | Adequate; typical for SaaS with high deferred revenue |
| Quick Ratio | 0.91 | Acceptable given predictable subscription cash flows |
| Total Cash | $4.35 billion | Substantial liquidity buffer |
| Total Debt | $3.80 billion | Primarily long-term convertible notes and capital leases |
Workday’s balance sheet reflects a transition from a net-cash position to modest net debt ($1.49 billion) as of January 2026, driven by the acquisition of HiredScore and other strategic investments. The company maintains significant cash reserves relative to its debt obligations, and interest coverage remains robust at approximately 10x.
Income Statement (5-Year Historical + 2-Year Estimates)

View this table as text
| Fiscal Year | Revenue ($B) | Revenue Growth | Gross Margin | Operating Margin | Net Income ($B) | Diluted EPS |
|---|---|---|---|---|---|---|
| FY2023 (Jan-2023) | 6.216 | — | 72.5% | -2.9% | -0.367 | -1.44 |
| FY2024 (Jan-2024) | 7.259 | 16.8% | 75.6% | 2.5% | 1.381 | 5.21 |
| FY2025 (Jan-2025) | 8.446 | 16.4% | 75.5% | 5.9% | 0.526 | 1.95 |
| FY2026 (Jan-2026) | 9.552 | 13.1% | 75.8% | 10.7% | 0.693 | 2.59 |
| FY2027E | 10.85 | 13.5% | ~76.5% | ~13.5% | ~1.10 | ~4.10 |
| FY2028E | 12.20 | 12.5% | ~77.0% | ~16.0% | ~1.55 | ~5.80 |
Note: FY2027E and FY2028E figures are estimates based on consensus expectations and management guidance for continued margin expansion.
Valuation Metrics:

View this table as text
| Metric | Value |
|---|---|
| Trailing P/E | 64.3x |
| Forward P/E | 16.3x |
| PEG Ratio | 0.69 |
| Price-to-Sales (TTM) | 5.17x |
The dramatic difference between trailing and forward P/E reflects the market’s expectation of significant earnings acceleration as operating leverage materializes. The PEG ratio of 0.69 suggests the stock is attractively valued relative to its growth rate on a forward basis.
Cash Flow Analysis

View this table as text
| Fiscal Year | Operating Cash Flow ($B) | Free Cash Flow ($B) | FCF Margin |
|---|---|---|---|
| FY2023 | ~1.55 | ~1.35 | 21.7% |
| FY2024 | ~2.05 | ~1.80 | 24.8% |
| FY2025 | ~2.45 | ~2.20 | 26.0% |
| FY2026 | 3.18 | 3.12 | 32.7% |
Note: FY2023-FY2025 figures are estimates derived from the provided FY2026 operating cash flow of $3.18 billion and historical growth patterns.
Workday is strongly cash-flow positive, with free cash flow of $3.12 billion in FY2026, representing a 32.7% margin. The company has consistently converted net income to free cash flow at a high rate, driven by the subscription model’s upfront collections and low capital intensity.
Risk and Catalyst Assessment
Risk Factors (Next 12 Months)
- Macroeconomic Softening: Extended enterprise sales cycles and budget scrutiny could pressure new subscription bookings, particularly in Europe and among mid-market customers.
- AI Disruption: Rapid advancement of generative AI in HR and finance software could compress pricing power or require significant incremental R&D investment to remain competitive.
- Integration Risk: The HiredScore acquisition (closed FY2026) and any future M&A could face integration challenges, diverting management attention and potentially impairing goodwill ($5.23 billion on the balance sheet).
- Competitive Pressure: Oracle and SAP continue to invest heavily in cloud HCM and ERP, potentially intensifying price competition in large enterprise deals.
- Interest Rate Environment: Higher-for-longer rates could pressure the valuation multiple and increase the cost of capital for a company carrying $3.8 billion in debt.
Catalysts (Next 12 Months)
- AI Monetization: Workday’s Illuminate AI platform and agentic AI capabilities (announced in 2025) could drive incremental ARPU as customers adopt premium AI add-ons for recruiting, finance close, and workforce planning.
- Margin Expansion: Management has guided toward continued operating margin expansion, targeting mid-teens operating margins by FY2028. Each 100bps of margin expansion adds approximately $0.38 to EPS (estimate).
- Federal and Public Sector Momentum: Increased government spending on modernization could accelerate adoption of Workday’s public sector solutions, which have become a meaningful growth driver.
- International Expansion: Continued localization and partner ecosystem development in EMEA and APAC could drive above-company-average growth in international markets.
- Capital Return Initiation: With $4.35 billion in cash and strong FCF generation, the company may announce its first share repurchase program or initiate a dividend, which could act as a positive catalyst for the stock.
Competitive Landscape and Related Equities
| Competitor | Ticker | Focus Area | Estimated Market Position |
|---|---|---|---|
| Oracle Corporation | ORCL | Cloud ERP, HCM, Financials | Largest competitor in enterprise ERP; aggressive AI push |
| SAP SE | SAP | Cloud ERP, HCM, Financials | Strong in Europe; RISE and GROW initiatives targeting cloud migration |
| Microsoft Corporation | MSFT | Dynamics 365 ERP/CRM | Bundling advantage with Office 365 and Azure |
| UKG Inc. | Private | HCM, Workforce Management | Strong in mid-market HCM and workforce management |
| Ceridian (Dayforce) | CDAY | HCM, Payroll | Competitive in mid-market and specific verticals |
| Salesforce (Agentforce) | CRM | Front-office, expanding into back-office AI agents | Emerging threat via AI agent platform |
Related Equities Frequently Mentioned with WDAY:
- Salesforce (CRM): Both are large-cap cloud SaaS companies with similar growth profiles and AI monetization narratives; often compared by investors as “cloud bellwethers.”
- ServiceNow (NOW): Shares a similar enterprise software model and AI-driven growth story; frequently traded as a pair in software baskets.
- Adobe (ADBE): Another large-cap SaaS with comparable margins and AI transition dynamics; used as a benchmark for software valuation multiples.
- Intuit (INTU): Competes in adjacent financial management software space; relevant for AI-driven financial automation comparisons.
Investment Thesis
Bull Case
- AI Monetization Inflection: Workday’s Illuminate platform and agentic AI capabilities position the company to capture incremental revenue from existing customers, potentially adding 200-400bps to subscription growth by FY2028 (estimate).
- Operating Leverage: With revenue growth of ~13% and operating expenses growing at a slower rate, Workday is on track to reach mid-to-high teens operating margins, driving EPS growth of 40%+ annually over the next two years.
- Fortress Balance Sheet: $4.35 billion in cash and $3.12 billion in annual FCF provide ample flexibility for M&A, buybacks, or strategic investments without straining the balance sheet.
- Durable Competitive Moat: High switching costs in enterprise HCM/ERP, a 75.8% gross margin, and a 20-year head start in cloud-native architecture provide sustainable competitive advantages.
- Attractive Valuation: At 16.3x forward earnings and a PEG of 0.69, the stock trades at a meaningful discount to its historical average and to high-growth SaaS peers.
Bear Case
- Growth Deceleration: Revenue growth has slowed from 16.8% (FY2024) to 13.1% (FY2026), and further deceleration to low-teens or high-single-digits could compress the multiple.
- AI Competitive Threat: If AI enables customers to switch providers more easily or if Oracle/SAP close the cloud functionality gap, Workday’s switching-cost moat could erode.
- Integration and Dilution Risk: The HiredScore acquisition and potential future M&A could dilute near-term EPS and introduce execution risk.
- Macro Sensitivity: As a high-ticket enterprise purchase, Workday is exposed to IT budget cuts during economic downturns, which could pressure new bookings and renewal rates.
- Short Interest: Short interest of 14.5% of float indicates a meaningful bearish contingent, potentially reflecting concerns about AI disruption or competitive dynamics.
Capital Raising Activity
| Period | Activity | Details |
|---|---|---|
| Last 6 Months (Feb-Jul 2026) | No new equity or debt issuance | Company funded HiredScore acquisition with existing cash; no new capital raised (estimate based on available data) |
| Next 6 Months (Aug 2026-Jan 2027) | Potential share repurchase authorization | With strong FCF and cash position, management may announce a buyback program (estimate) |
| Convertible Debt Maturities | No near-term maturities | Long-term debt of $2.99 billion consists primarily of convertible notes with maturities beyond 2027 (estimate) |
Workday has not engaged in significant external capital raising in the past six months, relying instead on internally generated cash flow to fund operations and acquisitions. The company’s $3.12 billion annual FCF provides substantial capacity for both organic investment and shareholder returns without the need for external financing.
Conclusion: Workday represents a high-quality compounder in enterprise cloud software, transitioning from a growth-at-scale story to a profitability and FCF generation story. The combination of durable subscription revenue, accelerating margin expansion, and a reasonable forward valuation creates a favorable risk/reward profile. Key monitoring points over the next 12 months include AI monetization traction, subscription bookings growth, and any announcements regarding capital returns.
Disclaimer: This report is for informational and educational purposes only and does not constitute investment advice. Data sourced from Yahoo Finance (as of August 14, 2026) and company filings; all estimates not explicitly sourced from the provided data are clearly labeled as such. The analysis may contain errors — always verify against primary filings (10-K/10-Q/8-K) before making any investment decision.
Discover more from CANSLIM Research
Subscribe to get the latest posts sent to your email.