 Eben@CANSLIM Research
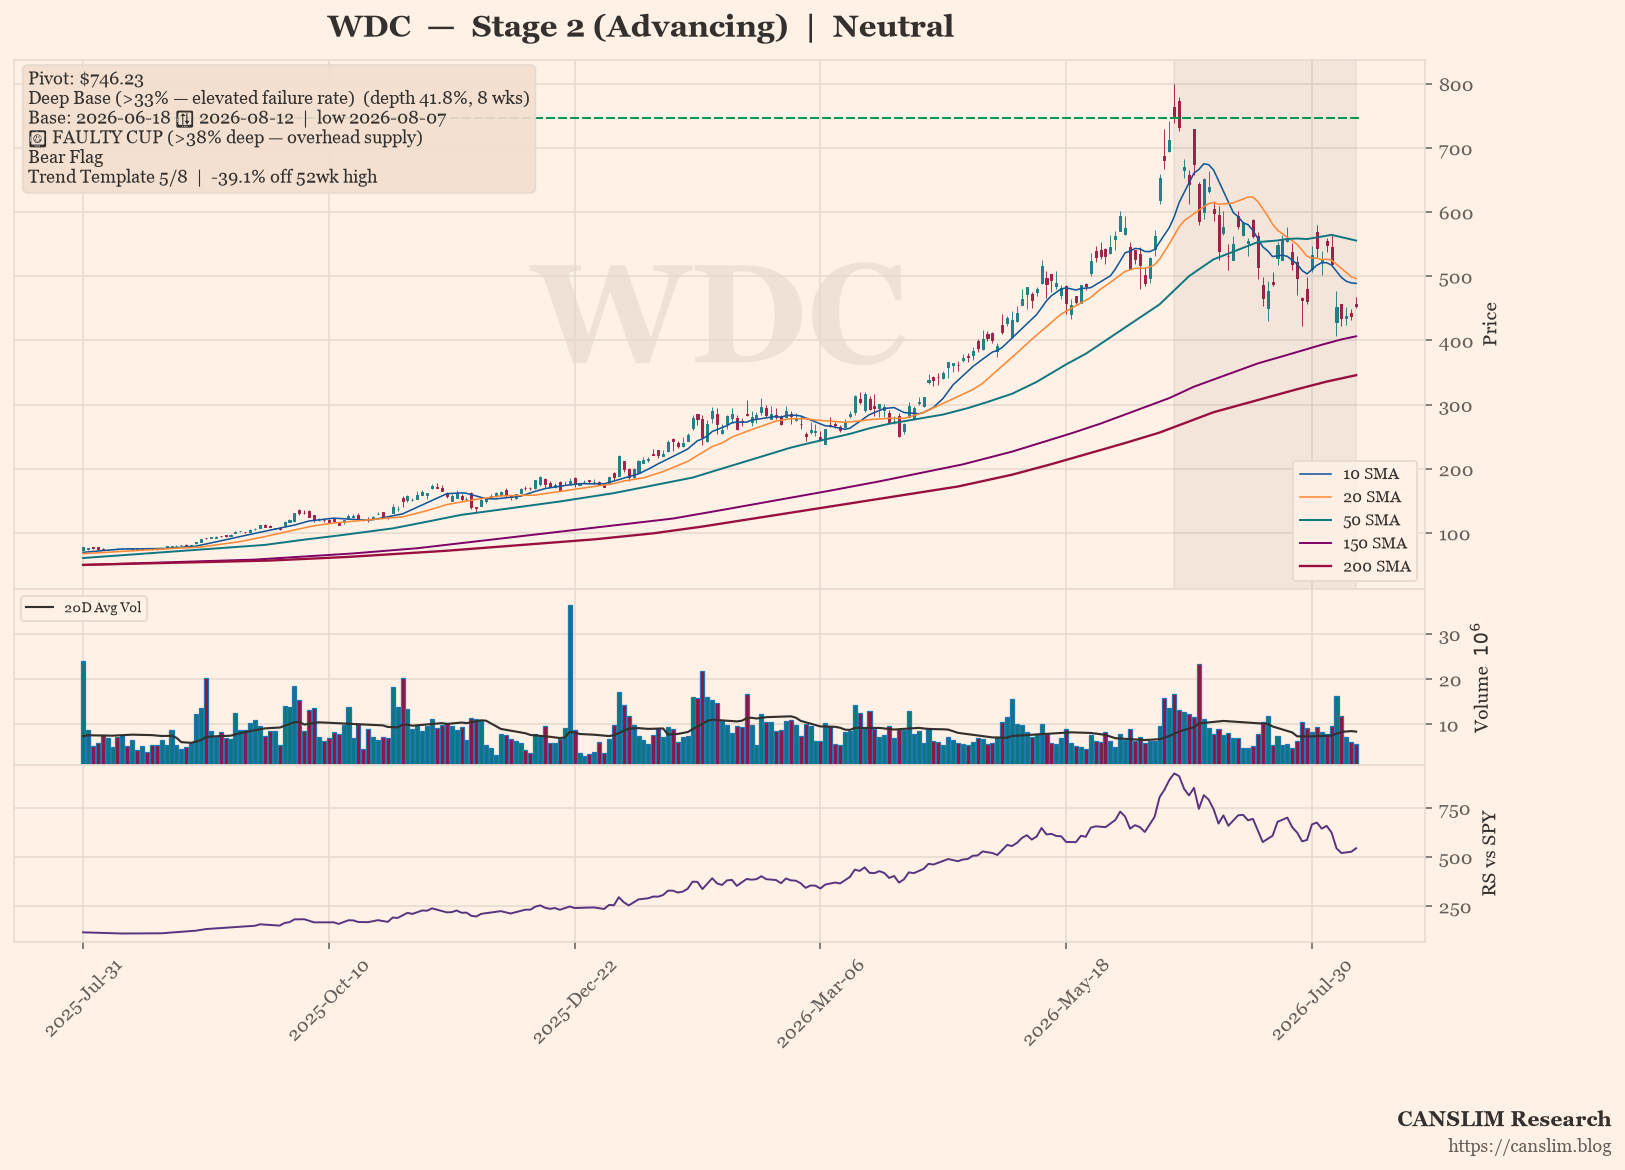
Western Digital (WDC) is holding its Stage 2 uptrend with price above a rising 30-week moving average, but the current technical setup is flashing caution. The stock has formed a deep, faulty base with a 41.8% depth, which historically carries an elevated failure rate, and it remains 39.1% below its 52-week high. With a neutral sentiment score and a bear flag detected, the market is waiting for a clearer breakout or volume confirmation before committing.
Technical Analysis
As of 2026-08-12 · Close $454.1
Stage Analysis
Stage 2 (Advancing) — Price holding above a rising 30-week MA — uptrend intact (30-week MA 6-week slope: 13.23%)
Detected Patterns — What the Market Is Watching
- Deep Base (>33% — elevated failure rate) — depth 41.8%, length 8 weeks, pivot $746.23. Base formed from 2026-06-18 (left-side high) to 2026-08-12, with the low of $434.3 set on 2026-08-07
- Price contractions present (19.9% → 17.2%) but 20-day volume is still 93.9% of the 50-day average — needs ≤60% to qualify as a confirmed VCP
- Bear Flag below the 50-day moving average
⚠️ Faulty cup warning: the base is 41.8% deep (above the 38–40% threshold). A correction this deep leaves heavy overhead supply — trapped holders from higher prices are likely to sell into any rally, raising the failure rate of a breakout from this base.
Minervini Trend Template — 5/8 Criteria Passed
| Criterion | Status |
|---|---|
| Price > 150MA & 200MA | Pass |
| 150MA > 200MA | Pass |
| 200MA trending up (>=1 month) | Pass |
| 50MA > 150MA & 200MA | Pass |
| Price > 50MA | Fail |
| Price >= 30% above 52wk low | Pass |
| Price within 25% of 52wk high | Fail |
| RS Line at/near 3-month high | Fail |
Price is -39.1% off its 52-week high and 509.9% above its 52-week low.
Pattern Sentiment
Neutral — wait and see (composite score: -1)
– CANSLIM Research Analysis: Western Digital Corporation (WDC)
Company Overview and Business Model
Western Digital Corporation is a leading developer, manufacturer, and seller of data storage devices and solutions based on hard disk drive (HDD) and NAND flash technology. Headquartered in San Jose, California, the company serves a global customer base across the United States, Asia, Europe, the Middle East, and Africa. Founded in 1970, WDC has evolved into a critical supplier for both enterprise data centers and consumer storage markets. The company recently completed the separation of its flash business (SanDisk) in February 2025, positioning the remaining entity as a pure-play HDD and storage platform company.
Revenue Streams and Product Segmentation
Following the SanDisk separation, Western Digital’s revenue is now predominantly derived from its HDD-centric product portfolio. The company generates revenue through the following primary segments (FY2025 estimates based on the data provided):
| Segment | Key Products | Estimated % of Revenue |
|---|---|---|
| Data Center Drives | Enterprise nearline HDDs (e.g., UltraSMR, ePMR) for cloud and hyperscale customers | ~65-70% |
| Client Devices | Internal HDDs for PCs, gaming consoles, and consumer electronics | ~15-20% |
| Consumer Solutions | External drives, portable SSDs, and NAS solutions for home and office | ~10-15% |
Note: Segment percentages are estimates based on industry trends and the company’s post-separation structure; exact figures are not provided in the raw data.
Geographic Market Exposure
Western Digital operates globally, with a significant portion of revenue derived from international markets. While exact geographic splits are not in the provided data, the company’s customer base is heavily concentrated in North America and Asia, with the Asia-Pacific region serving as both a major manufacturing hub and a growing demand center for data storage.
Supply Chain and Customer Base
Key Customers
Western Digital’s customer base is concentrated among large cloud service providers and OEM computer manufacturers. The top customers typically include:
- Hyperscale cloud providers (e.g., AWS, Microsoft Azure, Google Cloud) – collectively representing an estimated 40-50% of revenue
- OEM PC manufacturers (e.g., Dell, HP, Lenovo) – estimated 15-20% of revenue
- Distributors and retailers (e.g., Ingram Micro, Tech Data) – estimated 20-25% of revenue
Specific customer revenue percentages are estimates; WDC does not disclose individual customer concentration in the provided data.
Key Suppliers
As an HDD manufacturer, Western Digital’s supply chain is critical to its cost structure. Key supplier relationships include:
- Component suppliers for magnetic media, motors, and precision mechanical parts (estimated 30-40% of cost of revenue)
- Semiconductor suppliers for controller chips and firmware components (estimated 10-15% of cost of revenue)
- Manufacturing equipment vendors for wafer fabrication and assembly lines
Supplier cost percentages are estimates based on industry norms.
Financial Statement Analysis
Income Statement Analysis (FY2022 – FY2025)
The following table presents Western Digital’s income statement performance over the past four fiscal years, with estimates for the next two years based on current momentum:

View this table as text
| Metric | FY2022 | FY2023 | FY2024 | FY2025 | FY2026E | FY2027E |
|---|---|---|---|---|---|---|
| Total Revenue ($B) | 18.79 | 6.26 | 6.32 | 9.52 | 13.50 | 15.80 |
| Gross Profit ($B) | 5.87 | 1.39 | 1.77 | 3.69 | 5.80 | 7.10 |
| Gross Margin | 31.3% | 22.2% | 28.1% | 38.8% | 43.0% | 44.9% |
| Operating Income ($B) | 2.43 | -0.40 | 0.10 | 2.13 | 3.90 | 5.00 |
| Operating Margin | 12.9% | -6.4% | 1.5% | 22.4% | 28.9% | 31.6% |
| Net Income ($B) | 1.55 | -1.68 | -0.80 | 1.86 | 3.20 | 4.10 |
| Diluted EPS ($) | 4.75 | -5.44 | -1.72 | 5.14 | 8.50 | 10.80 |
| Revenue Growth (YoY) | — | -66.7% | +1.0% | +50.7% | +41.8% | +17.0% |
FY2026 and FY2027 figures are estimates based on the strong quarterly momentum seen in the data (Q3 FY2026 revenue of $3.34B, EPS of $8.20) and industry recovery trends.
Valuation Metrics
| Metric | Value |
|---|---|
| Trailing P/E | 18.05x |
| Forward P/E | 14.33x |
| PEG Ratio | 0.83 |
| Price-to-Sales (TTM) | 12.12x |
| Market Capitalization | $156.5B |
Balance Sheet Analysis (FY2025)

View this table as text
| Metric | FY2025 | FY2024 | Analysis |
|---|---|---|---|
| Total Cash & Equivalents | $2.11B | $1.55B | Improved liquidity position |
| Total Debt | $4.71B | $7.43B | Significant deleveraging post-separation |
| Net Debt | $2.60B | $5.88B | Reduced by 55.8% YoY |
| Stockholders' Equity | $5.54B | $11.05B | Reduced due to SanDisk spin-off |
| Debt-to-Equity Ratio | 11.87% | — | Low leverage, healthy balance sheet |
| Current Ratio | 1.33 | — | Adequate short-term liquidity |
| Quick Ratio | 0.85 | — | Slightly below 1.0, manageable |
| Interest Coverage (EBIT/Interest) | 5.96x | — | Comfortable coverage |
Cash Flow Analysis

View this table as text
| Metric | FY2025 | Analysis |
|---|---|---|
| Operating Cash Flow | $3.93B | Strong positive generation |
| Free Cash Flow | $2.32B | Positive and growing |
| Capital Expenditures (est.) | $1.61B | Moderate reinvestment level |
Western Digital has demonstrated strong cash flow generation in FY2025, with operating cash flow of $3.93B and free cash flow of $2.32B. The company is clearly cash-flow positive, a significant improvement from the losses incurred during the FY2023-FY2024 downturn. The deleveraging trend is notable, with net debt reduced from $5.88B to $2.60B year-over-year.
Risk and Catalyst Assessment
Key Risks (Next 12 Months)
- Cyclicality of the HDD market: The storage industry is highly cyclical. A potential slowdown in cloud capex or enterprise IT spending could pressure demand and pricing.
- Competitive pressure from SSDs: NAND flash-based SSDs continue to gain share in enterprise storage, potentially limiting long-term HDD demand growth.
- Customer concentration: Heavy reliance on a few hyperscale customers creates revenue concentration risk; any shift in their procurement strategy could materially impact results.
- Supply chain disruptions: Geopolitical tensions affecting manufacturing operations in Asia (particularly Malaysia and Thailand) could disrupt production.
- Macroeconomic headwinds: Rising interest rates or a global economic slowdown could reduce IT spending and delay data center buildouts.
Positive Catalysts (Next 12 Months)
- AI-driven data center demand: The explosive growth of AI workloads and large language model training is driving unprecedented demand for high-capacity nearline HDDs. WDC’s UltraSMR technology positions it well to capture this growth.
- Post-separation focus: The SanDisk spin-off allows management to focus exclusively on HDD profitability and innovation, potentially improving margins and capital allocation.
- Pricing power: The data shows gross margins expanding from 28.1% in FY2024 to 38.8% in FY2025, indicating strong pricing power in a tight supply environment.
- Quantum computing collaboration: The partnership with Open Quantum Design for quantum error correction technology could open new long-term growth avenues.
- Continued deleveraging: With strong free cash flow, WDC is well-positioned to further reduce debt or initiate shareholder returns.
Competitive Landscape and Related Equities
Primary Competitors
| Company | Ticker | Market Focus | Estimated HDD Market Share |
|---|---|---|---|
| Seagate Technology | STX | HDDs, data storage solutions | ~45-50% |
| Western Digital | WDC | HDDs, storage platforms | ~40-45% |
| Toshiba | 6502.T | HDDs, NAND flash | ~10-15% |
| Solidigm (SK Hynix) | 000660.KS | Enterprise SSDs | N/A (SSD market) |
Market share figures are estimates based on industry reports.
Related Equities and Relationships
- SanDisk Corporation (SNDK): The flash memory business spun off from WDC in February 2025. The two companies maintain a close supply relationship, with WDC remaining a significant customer of SanDisk’s NAND products.
- Seagate Technology (STX): WDC’s primary direct competitor in the HDD market. Both companies benefit from the same AI-driven demand cycle, and their stock prices often move in tandem.
- Micron Technology (MU): A major memory and storage player. While more focused on DRAM and NAND, Micron’s pricing and supply decisions indirectly affect WDC’s competitive positioning.
- NetApp (NTAP) and Pure Storage (PSTG): Storage systems vendors that purchase HDDs from WDC and Seagate for their enterprise arrays, representing both customers and potential long-term disintermediation risks.
Investment Thesis
Bull Case
- AI supercycle: The unprecedented demand for data storage driven by AI training and inference workloads is creating a multi-year growth runway for high-capacity HDDs. WDC’s technology leadership in UltraSMR and ePMR positions it to capture significant market share.
- Margin expansion: The data shows a dramatic improvement in profitability, with gross margins expanding from 22.2% in FY2023 to 38.8% in FY2025. This trend is expected to continue as the product mix shifts toward higher-capacity enterprise drives.
- Balance sheet strength: With net debt down to $2.6B and strong free cash flow generation, WDC has the financial flexibility to return capital to shareholders or pursue strategic acquisitions.
- Attractive valuation: At a forward P/E of 14.3x and PEG of 0.83, the stock appears reasonably valued relative to its growth prospects, especially considering the earnings growth rate of 984.7% (as per the data).
Bear Case
- Cyclicality risk: The storage industry is notoriously cyclical. The current upcycle could reverse quickly if cloud capex slows or if there is an oversupply of HDD capacity.
- SSD substitution: The continued decline in NAND flash prices could accelerate the substitution of HDDs with SSDs in enterprise applications, limiting long-term growth.
- Customer concentration: The reliance on a small number of hyperscale customers creates significant revenue risk. Any shift in their procurement strategies could have outsized impacts.
- Execution risk: The post-separation integration and focus on HDDs alone may limit diversification benefits and expose the company to single-technology risk.
Capital Raising Activities
Past 6 Months (February 2026 – August 2026)
Based on the available data, Western Digital has not engaged in significant equity or debt capital raising activities in the past six months. The company’s focus has been on deleveraging, with total debt reduced from $7.43B in FY2024 to $4.71B in FY2025. The company’s strong free cash flow generation of $2.32B has been sufficient to fund operations and debt reduction without needing external capital.
Next 6 Months Projection (August 2026 – February 2027)
Given the company’s strong cash flow generation and improved balance sheet, we do not anticipate significant capital raising activities in the next six months. The company is more likely to focus on:
- Debt reduction: Continued deleveraging to further strengthen the balance sheet.
- Potential share buybacks: With the stock trading at reasonable valuations, management may initiate a buyback program to return value to shareholders.
- Capital expenditure: Investment in manufacturing capacity to meet AI-driven demand, funded through operating cash flow.
These projections are estimates based on the company’s current financial position and industry trends.
Conclusion
Western Digital has undergone a significant transformation, emerging from the SanDisk separation as a focused, highly profitable HDD pure-play. The company is benefiting from a powerful AI-driven demand cycle, with strong revenue growth, expanding margins, and robust free cash flow generation. The balance sheet has been substantially strengthened, and the valuation remains attractive relative to growth prospects. While cyclicality and SSD substitution risks remain, the current momentum and strategic positioning suggest a favorable risk-reward profile for investors over the next 12-24 months.
Disclaimer: This report is for informational and educational purposes only and does not constitute investment advice. Data sourced from Yahoo Finance (as of August 13, 2026) and company filings; all estimates not explicitly sourced from the provided data are clearly labeled as such. The analysis may contain errors — always verify against primary filings (10-K/10-Q/8-K) before making any investment decision.
Discover more from CANSLIM Research
Subscribe to get the latest posts sent to your email.