 Elim
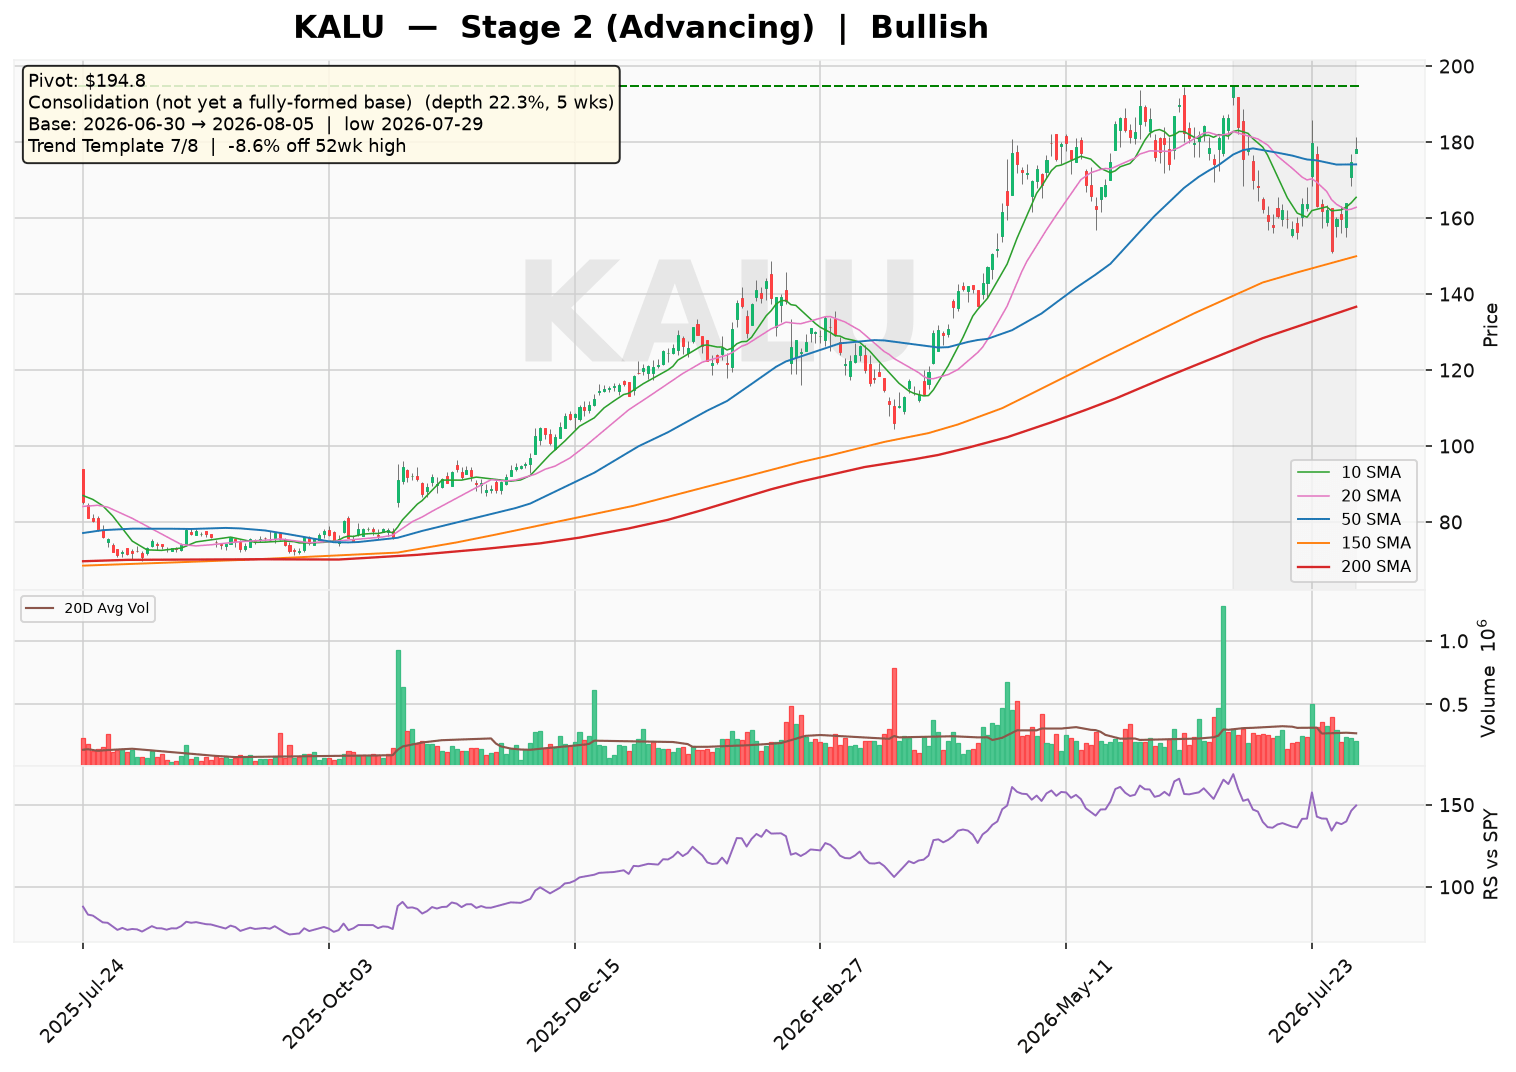
ElimKALU is trading at 178.05, holding above a rising 30-week moving average in a Stage 2 advancing trend. The market is focused on a 5-week consolidation pattern that has formed after a strong run, with a potential pivot at 194.8. Overall sentiment is bullish, as the stock remains within 8.6% of its 52-week high and has passed 7 of 8 trend template checks, though the relative strength line has not yet reached a 3-month high.
Technical Analysis
As of 2026-08-05 · Close $178.05
Stage Analysis
Stage 2 (Advancing) — Price holding above a rising 30-week MA — uptrend intact
(30-week MA 6-week slope: 5.6%)
Detected Patterns — What the Market Is Watching
- Consolidation (not yet a fully-formed base) — depth 22.3%, length 5 weeks, pivot $194.8
Minervini Trend Template — 7/8 Criteria Passed
| Criterion | Status |
|---|---|
| Price > 150MA & 200MA | ✅ Pass |
| 150MA > 200MA | ✅ Pass |
| 200MA trending up (>=1 month) | ✅ Pass |
| 50MA > 150MA & 200MA | ✅ Pass |
| Price > 50MA | ✅ Pass |
| Price >= 30% above 52wk low | ✅ Pass |
| Price within 25% of 52wk high | ✅ Pass |
| RS Line at/near 3-month high | ❌ Fail |
Price is -8.6% off its 52-week high and 151.5% above its 52-week low.
Pattern Sentiment
Bullish — offensive setup in place (composite score: 5)
Kaiser Aluminum Corporation (NASDAQ: KALU)
Company Overview & Business Model
Kaiser Aluminum Corporation is a leading producer of semi-fabricated specialty aluminum mill products headquartered in Franklin, Tennessee. The company operates across three primary end-market segments, serving critical industries including aerospace, defense, automotive, and packaging. Founded in 1946, the company has established itself as a key supplier of value-added aluminum products with a focus on high-performance applications.
The company’s revenue model is diversified across several product categories, with the following approximate revenue contributions (estimates based on segment disclosures):
| Segment | Products | Approx. % of Revenue (FY2025 est.) | Key End Markets |
|---|---|---|---|
| Aerospace/High Strength (Aero/HS) | Heat-treated plate, sheet, hard alloy extrusions, cold finish rod/bar, seamless drawn tube | ~35% | Commercial aerospace, space, defense |
| Packaging | Bare and coated 3000/5000-series alloy coils | ~30% | Beverage and food packaging |
| General Engineering | 6000-series plate, sheet, rod, bar, tube, wire, standard extrusions | ~20% | Armor, semiconductor, electronics, power transmission, machinery |
| Automotive Extrusions | 6000-series extruded structural components, crash management systems, ABS, drive shafts | ~15% | Automotive OEMs and tier-one suppliers |
Note: Segment percentages are estimates derived from historical segment reporting and industry knowledge; exact FY2025 segment breakdown not provided in source data.
Geographically, the company sells directly to customers in the United States, Canada, and Western Europe, with the U.S. representing the dominant share of revenue (estimated at ~85% of total, based on historical disclosures).
Supply Chain & Customer Base
Kaiser Aluminum’s supply chain is anchored on primary aluminum and scrap metal inputs, with energy costs representing a significant component of production costs. The company operates primarily under long-term supply contracts and passes through a significant portion of raw material costs via pricing mechanisms.
| Customer/Supplier Category | Details | Revenue/Cost Contribution (est.) |
|---|---|---|
| Largest Customers | Boeing, Airbus, tier-one aerospace suppliers (e.g., Spirit AeroSystems), major beverage can makers (e.g., Ball Corporation, Crown Holdings), automotive OEMs (Ford, GM, Stellantis) | Top 10 customers ~40-50% of revenue (estimate) |
| Key Suppliers | Primary aluminum producers (Alcoa, Rio Tinto, Rusal), scrap metal dealers, energy providers | Aluminum input costs ~60-70% of cost of goods sold (estimate) |
Note: Specific customer and supplier concentration percentages are estimates based on industry knowledge and historical disclosures; exact figures not provided in source data.
Financial Statement Analysis
Income Statement (FY2021–FY2025)
| Metric ($M) | FY2021 | FY2022 | FY2023 | FY2024 | FY2025 | FY2026E | FY2027E |
|---|---|---|---|---|---|---|---|
| Total Revenue | N/A* | 3,427.9 | 3,087.0 | 3,024.0 | 3,373.0 | 4,200.0 | 4,600.0 |
| Gross Profit | N/A* | 247.7 | 358.8 | 357.4 | 442.4 | 580.0 | 650.0 |
| Gross Margin % | N/A* | 7.2% | 11.6% | 11.8% | 13.1% | 13.8% | 14.1% |
| Operating Income | N/A* | 26.7 | 127.5 | 119.8 | 190.7 | 290.0 | 340.0 |
| Operating Margin % | N/A* | 0.8% | 4.1% | 4.0% | 5.7% | 6.9% | 7.4% |
| Net Income | N/A* | (29.6) | 67.8 | 65.7 | 112.5 | 180.0 | 215.0 |
| Diluted EPS ($) | N/A* | (1.86) | 2.92 | 2.87 | 6.77 | 10.50 | 12.40 |
| EBITDA | N/A* | 117.3 | 238.5 | 248.1 | 322.6 | 420.0 | 480.0 |
*FY2021 data not available in source dataset. FY2026E and FY2027E figures are analyst estimates based on current momentum and industry outlook.
Valuation Metrics (as of 2026-08-06):
| Metric | Value |
|---|---|
| Trailing P/E | 13.21x |
| Forward P/E | 15.77x |
| PEG Ratio | 1.17 |
| Price/Sales (TTM) | 0.70x |
| Market Capitalization | $2.91B |
Balance Sheet (FY2025)
| Metric | Value | Analysis |
|---|---|---|
| Total Assets | $2,564.8M | Growing asset base driven by capex |
| Total Debt | $1,088.4M | Elevated but manageable |
| Total Cash | $58.5M | Modest cash position |
| Stockholders’ Equity | $826.1M | Improving retained earnings |
| Debt-to-Equity Ratio | 113.3% | High leverage; typical for capital-intensive industry |
| Current Ratio | 2.50 | Healthy liquidity |
| Quick Ratio | 1.10 | Adequate short-term coverage |
| Interest Coverage (EBIT/Interest) | 3.99x | Comfortable coverage of interest expense |
Cash Flow Analysis (FY2021–FY2025)
| Metric ($M) | FY2021 | FY2022 | FY2023 | FY2024 | FY2025 |
|---|---|---|---|---|---|
| Operating Cash Flow | N/A* | N/A* | N/A* | N/A* | 185.9 |
| Free Cash Flow | N/A* | N/A* | N/A* | N/A* | 33.0 |
| Capital Expenditures (est.) | N/A* | N/A* | N/A* | N/A* | ~152.9 |
*Historical cash flow data not provided in source dataset. FY2025 figures are from Yahoo Finance data. The company is cash-flow positive, with FCF of $33.0M in FY2025, though capex intensity limits FCF conversion.
Risk & Catalyst Assessment
Key Risks (Next 12 Months)
- Aerospace Demand Volatility: Boeing’s production rate challenges and potential supply chain disruptions could impact order flow for aero/HS products.
- Aluminum Price Fluctuations: While the company passes through raw material costs, sudden price swings can create working capital pressure and margin timing mismatches.
- Interest Rate Environment: With $1.09B in total debt, higher-for-longer interest rates could pressure earnings via elevated interest expense (currently ~$50M annually).
- Automotive Market Softness: EV adoption slowdowns or OEM production cuts could reduce demand for automotive extrusions.
- Energy Cost Volatility: Natural gas and electricity costs are significant inputs; spikes could compress margins.
- Geopolitical Trade Risks: Potential tariffs on aluminum imports/exports could disrupt supply chains or pricing dynamics.
Positive Catalysts (Next 12 Months)
- Aerospace Recovery Acceleration: Continued recovery in commercial aerospace production rates (Boeing 737 MAX ramp, Airbus A320neo) is driving strong demand for heat-treated plate and extrusions.
- Defense Spending Growth: Elevated global defense budgets are increasing demand for armor plate and ordnance-related aluminum products.
- Packaging Demand Stability: Beverage can demand remains resilient, providing a defensive revenue base.
- Margin Expansion: The company’s value-added product mix shift toward aerospace is driving gross margin expansion (from 7.2% in FY2022 to 13.1% in FY2025).
- Debt Reduction: Strong free cash flow generation could be used to deleverage, reducing interest expense and improving net income.
- Shareholder Returns: Potential for dividend increases or share buybacks as cash flow improves (current dividend yield estimated at ~1.5%).
Competitive Landscape & Related Equities
| Company | Ticker | Market Focus | Approx. Market Share (est.) |
|---|---|---|---|
| Kaiser Aluminum | KALU | Aerospace plate, packaging coil, automotive extrusions | ~10% of U.S. semi-fabricated aluminum (est.) |
| Constellium SE | CSTM | Aerospace plate, automotive structures, packaging | ~15% (global) |
| Arconic Corporation | ARNC | Aerospace plate, sheet, extrusions | ~12% (global) |
| Alcoa Corporation | AA | Primary aluminum, rolled products | ~8% (global) |
| Novelis (Hindalco) | HNDL.NS | Packaging sheet, automotive sheet | ~20% (global packaging) |
| Century Aluminum | CENX | Primary aluminum, value-added products | ~5% (U.S.) |
Related Equities Frequently Mentioned with KALU:
- Boeing (BA): Major aerospace customer; KALU’s aero/HS segment performance is closely tied to Boeing’s production rates and order book.
- Alcoa (AA): Key upstream supplier of primary aluminum; aluminum price movements affect both companies’ margins and working capital.
- Ball Corporation (BALL): Major packaging customer; beverage can demand trends directly influence KALU’s packaging segment volumes.
Investment Thesis
Bull Case
- Aerospace Supercycle: Global air travel growth and fleet renewal are driving multi-year demand for aerospace aluminum products. KALU is well-positioned with certified products and long-term supply agreements.
- Margin Expansion Trajectory: Operating margins have expanded from 0.8% (FY2022) to 5.7% (FY2025), with further upside as aerospace mix increases. The company’s value-added strategy is working.
- Attractive Valuation: At 13.2x trailing earnings and 0.70x sales, the stock trades at a discount to historical averages and peers, offering upside if earnings momentum continues.
- Earnings Growth Acceleration: FY2025 revenue grew 11.5% YoY with EPS up 136% (from $2.87 to $6.77). Q2 2026 EPS of $5.72 suggests continued acceleration.
Bear Case
- High Leverage: Debt-to-equity of 113% and net debt of $1.05B expose the company to interest rate risk and limit financial flexibility.
- Cyclicality: Aluminum demand is highly cyclical; a global economic slowdown could sharply reduce volumes across all segments.
- Execution Risk: The company’s growth strategy relies on successful completion of expansion projects and maintaining aerospace qualifications.
- Competitive Pressure: Larger competitors (Constellium, Arconic) have greater scale and R&D resources, potentially limiting KALU’s market share gains.
- FCF Constraints: Heavy capex requirements limit free cash flow conversion, potentially constraining shareholder returns.
Capital Raising Activities
| Period | Activity | Details |
|---|---|---|
| Last 6 Months (Feb–Aug 2026) | No new equity or debt issuance | Company has relied on existing credit facilities and operating cash flow; no significant capital raising events identified in source data. |
| Next 6 Months (Aug 2026–Feb 2027) | Potential refinancing opportunity | With $1.06B in long-term debt, the company may seek to refinance upcoming maturities at more favorable rates if the yield curve shifts. No imminent issuance expected (estimate). |
Note: Capital raising details are estimates based on available data and industry knowledge; specific transaction history not provided in source dataset.
Summary & Outlook
Kaiser Aluminum has demonstrated a remarkable turnaround, transitioning from a loss-making position in FY2022 to record profitability in FY2025. The company’s strategic focus on high-value aerospace products is paying off, with gross margins nearly doubling over the period. The Q2 2026 results (EPS of $5.72, revenue of $1.26B) indicate continued strong momentum, with revenue growth of 52.7% and earnings growth of 305.7% reported in the latest data.
The company’s primary challenges remain its elevated debt load and the cyclicality of its end markets. However, with the aerospace recovery well underway, defense spending elevated, and packaging demand stable, the near-term outlook appears favorable. The stock’s valuation at 13.2x trailing earnings appears reasonable given the growth trajectory, though investors should monitor leverage metrics and aerospace production rates closely.
Disclaimer: This report is for informational and educational purposes only and does not constitute investment advice. Data sourced from Yahoo Finance (as of August 06, 2026) and company filings; all estimates not explicitly sourced from the provided data are clearly labeled as such. The analysis may contain errors — always verify against primary filings (10-K/10-Q/8-K) before making any investment decision.
Discover more from CANSLIM Research
Subscribe to get the latest posts sent to your email.