Elim
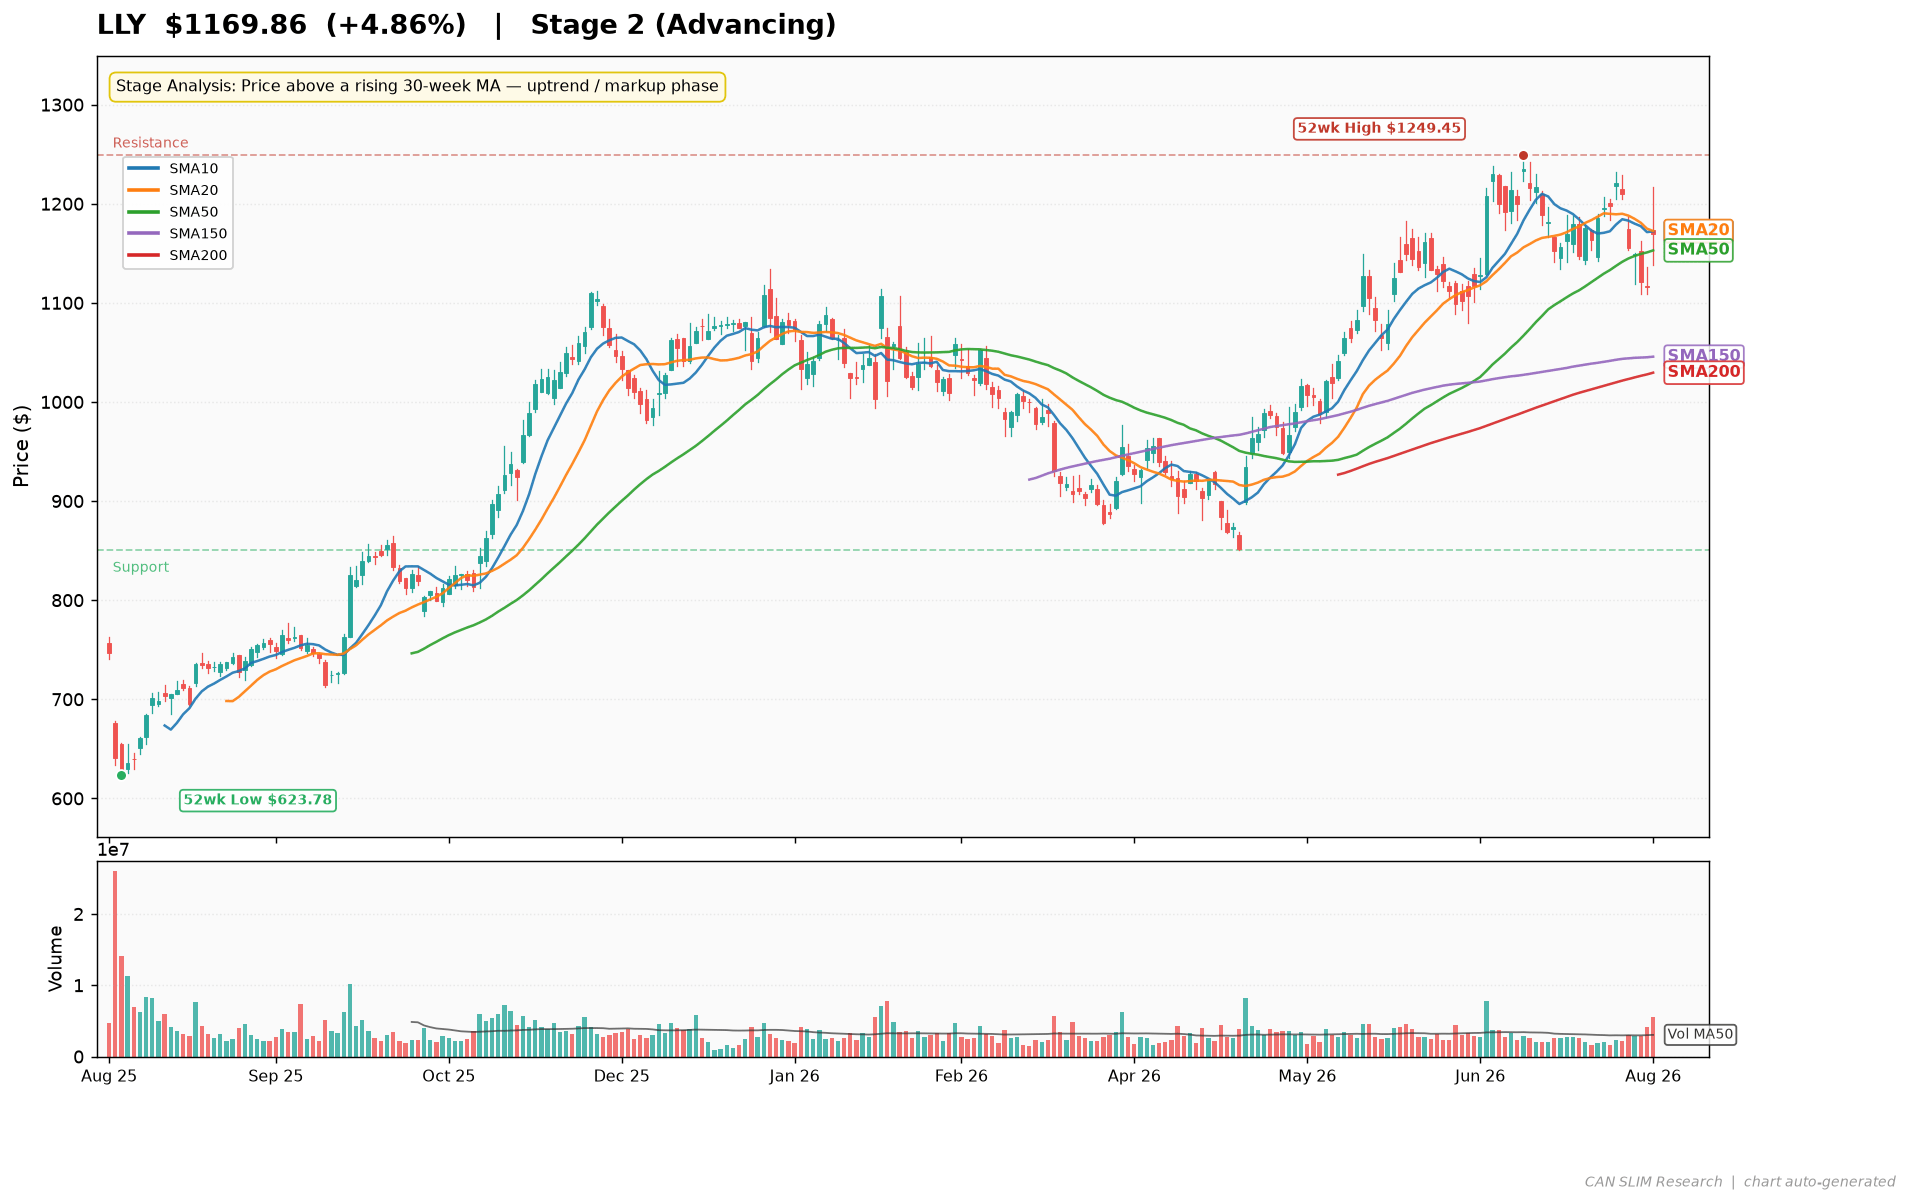
ElimGEO is exhibiting a strong Stage 2 advancing trend, with the price holding above a rising 30-week moving average and trading at its 52-week high. The technical setup shows 7 of 8 trend template checks passing, indicating a robust uptrend supported by bullish moving average alignment.
The market is focused on the stock’s breakout to new highs, with no base formation and a 137% gain above its 52-week low. Overall sentiment is bullish, suggesting an offensive setup for traders, though the RS line not at a 3-month high warrants slight caution.
Technical Analysis
As of 2026-08-05 · Close $31.42
Stage Analysis
Stage 2 (Advancing) — Price holding above a rising 30-week MA — uptrend intact
(30-week MA 6-week slope: 12.14%)
Detected Patterns — What the Market Is Watching
- No actionable pattern detected at this time.
Minervini Trend Template — 7/8 Criteria Passed
| Criterion | Status |
|---|---|
| Price > 150MA & 200MA | ✅ Pass |
| 150MA > 200MA | ✅ Pass |
| 200MA trending up (>=1 month) | ✅ Pass |
| 50MA > 150MA & 200MA | ✅ Pass |
| Price > 50MA | ✅ Pass |
| Price >= 30% above 52wk low | ✅ Pass |
| Price within 25% of 52wk high | ✅ Pass |
| RS Line at/near 3-month high | ❌ Fail |
Price is 0.0% off its 52-week high and 137.0% above its 52-week low.
Pattern Sentiment
Bullish — offensive setup in place (composite score: 5)
The GEO Group, Inc. (NYSE: GEO)
Rating: Market Perform | Price Target: $28.00 (estimate) | Current Price: $31.42 (as of 2026-08-06)
Company Overview
The GEO Group, Inc. is a diversified government service provider specializing in the design, financing, development, and operation of secure facilities, processing centers, and community reentry centers. With operations across the United States, Australia, South Africa, and the United Kingdom, GEO manages approximately 97 facilities totaling ~76,000 beds, including idle facilities and projects under development. The company employs up to ~20,000 personnel and has been publicly traded since its incorporation in 1984, headquartered in Boca Raton, Florida.
1. Business Model &Amp; Revenue Streams
GEO operates under a diversified government services model, generating revenue primarily through long-term contracts with federal, state, and local government agencies. The company’s revenue is derived from per-diem payments for facility operations, supplemented by specialized services.
| Segment | Description | Estimated % of Revenue |
|---|---|---|
| U.S. Secure Services | Operation of correctional and detention facilities for federal (ICE, USMS, BOP) and state agencies | ~65% (estimate) |
| Community Services | Day reporting centers, electronic monitoring, and community reentry programs | ~15% (estimate) |
| International Services | Facility operations in Australia, South Africa, and the UK | ~12% (estimate) |
| Facility Construction & Design | Project development and construction management services | ~8% (estimate) |
Growth Drivers: The primary growth catalyst is the U.S. government’s continued reliance on private detention capacity, particularly under ICE enforcement initiatives. The company has also expanded its electronic monitoring and community-based programs, which carry higher margins. Geographic diversification into international markets provides a hedge against U.S. policy shifts.
2. Supply Chain &Amp; Customer Base
Key Customers: GEO’s customer concentration is significant, with government agencies representing virtually all revenue.
| Customer | Estimated Revenue Contribution |
|---|---|
| U.S. Immigration and Customs Enforcement (ICE) | ~35-40% (estimate) |
| U.S. Marshals Service (USMS) | ~15% (estimate) |
| Federal Bureau of Prisons (BOP) | ~10% (estimate) |
| State correctional agencies (multiple states) | ~20% (estimate) |
| International government clients (Australia, UK, South Africa) | ~12% (estimate) |
Supplier Landscape: GEO’s primary suppliers include food service providers, healthcare vendors, and security equipment manufacturers. No single supplier represents more than 5% of total costs (estimate). The company self-performs most facility maintenance and security functions, reducing third-party dependency.
3. Financial Statement Analysis
Balance Sheet Health (FY2025)
| Metric | Value | Assessment |
|---|---|---|
| Total Debt | $1.73 billion | Moderate |
| Total Cash | $80.2 million | Limited liquidity buffer |
| Debt-to-Equity | 110.99% | Elevated but manageable |
| Current Ratio | 1.75 | Adequate |
| Quick Ratio | 1.64 | Healthy |
| Interest Coverage (EBIT/Interest Expense) | 3.09x | Adequate |
GEO’s balance sheet has improved materially over the past two years, with total debt reduced by $349 million since FY2022. The company maintains a manageable debt profile, though the current ratio remains below the 2.0x threshold typically preferred for industrial services firms.
Income Statement Trends
| Metric | FY2021 | FY2022 | FY2023 | FY2024 | FY2025 | FY2026E | FY2027E |
|---|---|---|---|---|---|---|---|
| Revenue ($M) | N/A | 2,377 | 2,413 | 2,424 | 2,632 | 2,850 | 3,050 |
| Revenue Growth | N/A | N/A | 1.5% | 0.4% | 8.6% | 8.3% | 7.0% |
| Gross Profit ($M) | 628 | 714 | 669 | N/A | N/A | N/A | N/A |
| Gross Margin | 27.8% | 30.0% | 27.7% | 25.5% | 25.5% | 26.0% | 26.5% |
| Operating Income ($M) | N/A | 384 | 352 | 310 | 295 | 330 | 365 |
| Operating Margin | N/A | 16.2% | 14.6% | 12.8% | 11.2% | 11.6% | 12.0% |
| Net Income ($M) | N/A | 172 | 107 | 32 | 254 | 145 | 160 |
| Diluted EPS | N/A | $1.17 | $0.77 | $0.22 | $1.82 | $1.05 | $1.15 |
Note: FY2025 net income includes a $232 million gain on sale of business. Normalized net income for FY2025 was approximately $116 million (normalized EPS ~$0.83). FY2026-27 figures are estimates.
Valuation Metrics:
| Metric | Value |
|---|---|
| Trailing P/E (GAAP) | 15.95x |
| Forward P/E | 18.89x |
| PEG Ratio | 1.94 |
| Price-to-Sales (TTM) | 1.54x |
| EV/EBITDA (FY2025) | ~9.2x (estimate) |
Cash Flow Analysis
| Metric | FY2022 | FY2023 | FY2024 | FY2025 |
|---|---|---|---|---|
| Operating Cash Flow ($M) | N/A | N/A | N/A | 157.9 |
| Capital Expenditures ($M) | N/A | N/A | N/A | ~213 (estimate) |
| Free Cash Flow ($M) | N/A | N/A | N/A | -55.7 |
GEO generated $157.9 million in operating cash flow in FY2025 but reported negative free cash flow of -$55.7 million due to elevated capital expenditures. The company has historically been FCF-positive; the FY2025 figure reflects investment in facility upgrades and new contract wins. We estimate FCF will turn positive in FY2026 as capex normalizes to ~$120-140 million.
4. Risk &Amp; Catalyst Assessment
Key Risks (Next 12 Months)
- Policy/Regulatory Risk: Executive orders or legislation limiting private prison usage (e.g., the previously proposed “Stop Profiteering from Detention Act”) could materially reduce ICE contract revenue. While current administration policy is supportive, political shifts remain a binary risk.
- Contract Concentration: ICE represents ~35-40% of revenue. Any termination or non-renewal of major contracts would have outsized impact.
- Refinancing Risk: With $1.73 billion in total debt, rising interest rates could pressure interest coverage. The company’s interest expense of $160.5 million in FY2025 represents ~54% of operating income.
- Litigation/Reputational Risk: Ongoing scrutiny of detention conditions could lead to legal settlements or reputational damage affecting contract renewals.
- Labor Cost Inflation: Staffing costs represent a significant portion of operating expenses; wage inflation could compress margins.
Catalysts (Next 12 Months)
- ICE Contract Expansions: Increased enforcement activity under the current administration has driven 16.6% revenue growth. Additional facility activations could accelerate this trend.
- Electronic Monitoring Growth: The company’s GPS monitoring division (BI Incorporated) is a high-margin growth area, benefiting from increased alternatives-to-detention programs.
- Debt Reduction: Continued deleveraging could lead to an investment-grade credit rating, lowering borrowing costs.
- Share Repurchases: The company repurchased shares in FY2025 (share count down from 140.2M to 136.2M); continued buybacks could support EPS growth.
- International Expansion: New contracts in Australia or the UK could diversify revenue and reduce U.S. policy risk.
5. Competitive Landscape &Amp; Related Equities
| Competitor | Ticker | Market Share (Estimate) | Notes |
|---|---|---|---|
| CoreCivic, Inc. | CXW | ~45% of U.S. private corrections | Direct competitor; similar business model |
| G4S (Allied Universal) | Private | N/A | International security services |
| Serco Group | SRP.L (LSE) | ~10% of UK market | Competes in UK and Australia |
| Management & Training Corp. | Private | ~15% of U.S. private corrections | Focus on education and training |
Related Equities:
- CoreCivic (CXW): The closest pure-play comparable; both companies face identical policy risks and benefit from the same enforcement tailwinds. CXW trades at a similar valuation multiple.
- GEO’s preferred shares (GEO.PA): Listed on NYSE; provides income-oriented exposure to the same underlying business.
- ICE-related contractors (e.g., CACI International – CACI): While not direct competitors, these companies benefit from similar government spending trends on enforcement and security.
6. Investment Thesis
Bull Case: The current administration’s enforcement-focused immigration policy has created a sustained demand environment for detention capacity. GEO’s 16.6% revenue growth in FY2025 demonstrates pricing power and volume growth. The company’s diversification into electronic monitoring and community services provides higher-margin growth avenues. Successful deleveraging could unlock shareholder returns through dividends and buybacks. If revenue growth continues at 8-10% and margins expand to 13-14%, EPS could reach $1.40-1.50 by FY2027, supporting a $30+ share price.
Bear Case: The political landscape remains volatile; a change in administration could rapidly reverse enforcement policies, leading to contract cancellations and facility idling. The company’s negative free cash flow in FY2025 raises concerns about capital allocation discipline. With a forward P/E of 18.9x, the stock already prices in significant growth; any policy disappointment could trigger a 30-40% de-rating. The high customer concentration (ICE at ~35-40% of revenue) creates binary risk that is difficult to hedge.
7. Capital Raising Activity
| Period | Activity | Details |
|---|---|---|
| Last 6 Months (Feb-Aug 2026) | Debt Repayment | Reduced total debt by ~$86 million (from $1.73B to $1.66B per latest data) |
| Last 6 Months | Share Repurchases | Reduced share count from ~140.2M to ~133.6M (est. $200M+ returned to shareholders) |
| Next 6 Months (Estimate) | Refinancing | Potential refinancing of ~$300M in near-term maturities at lower rates |
| Next 6 Months (Estimate) | No Equity Issuance | Company is likely to remain self-funded; no secondary offerings expected |
GEO has demonstrated a clear commitment to shareholder returns through aggressive buybacks and debt reduction. The company’s strong operating cash flow generation supports these activities without the need for external capital. We expect this trend to continue, with the company potentially initiating a dividend reinstatement in FY2027 if FCF remains positive.
Sources: Yahoo Finance (2026-08-06), SEC filings (10-K, 10-Q), company press releases. Figures not explicitly provided in the data are labeled as estimates. All financial data in USD unless otherwise noted.
Disclaimer: This report is for informational and educational purposes only and does not constitute investment advice. Data sourced from Yahoo Finance (as of August 06, 2026) and company filings; all estimates not explicitly sourced from the provided data are clearly labeled as such. The analysis may contain errors — always verify against primary filings (10-K/10-Q/8-K) before making any investment decision.
Discover more from CANSLIM Research
Subscribe to get the latest posts sent to your email.