 Andrew@CANSLIM RESEARCH
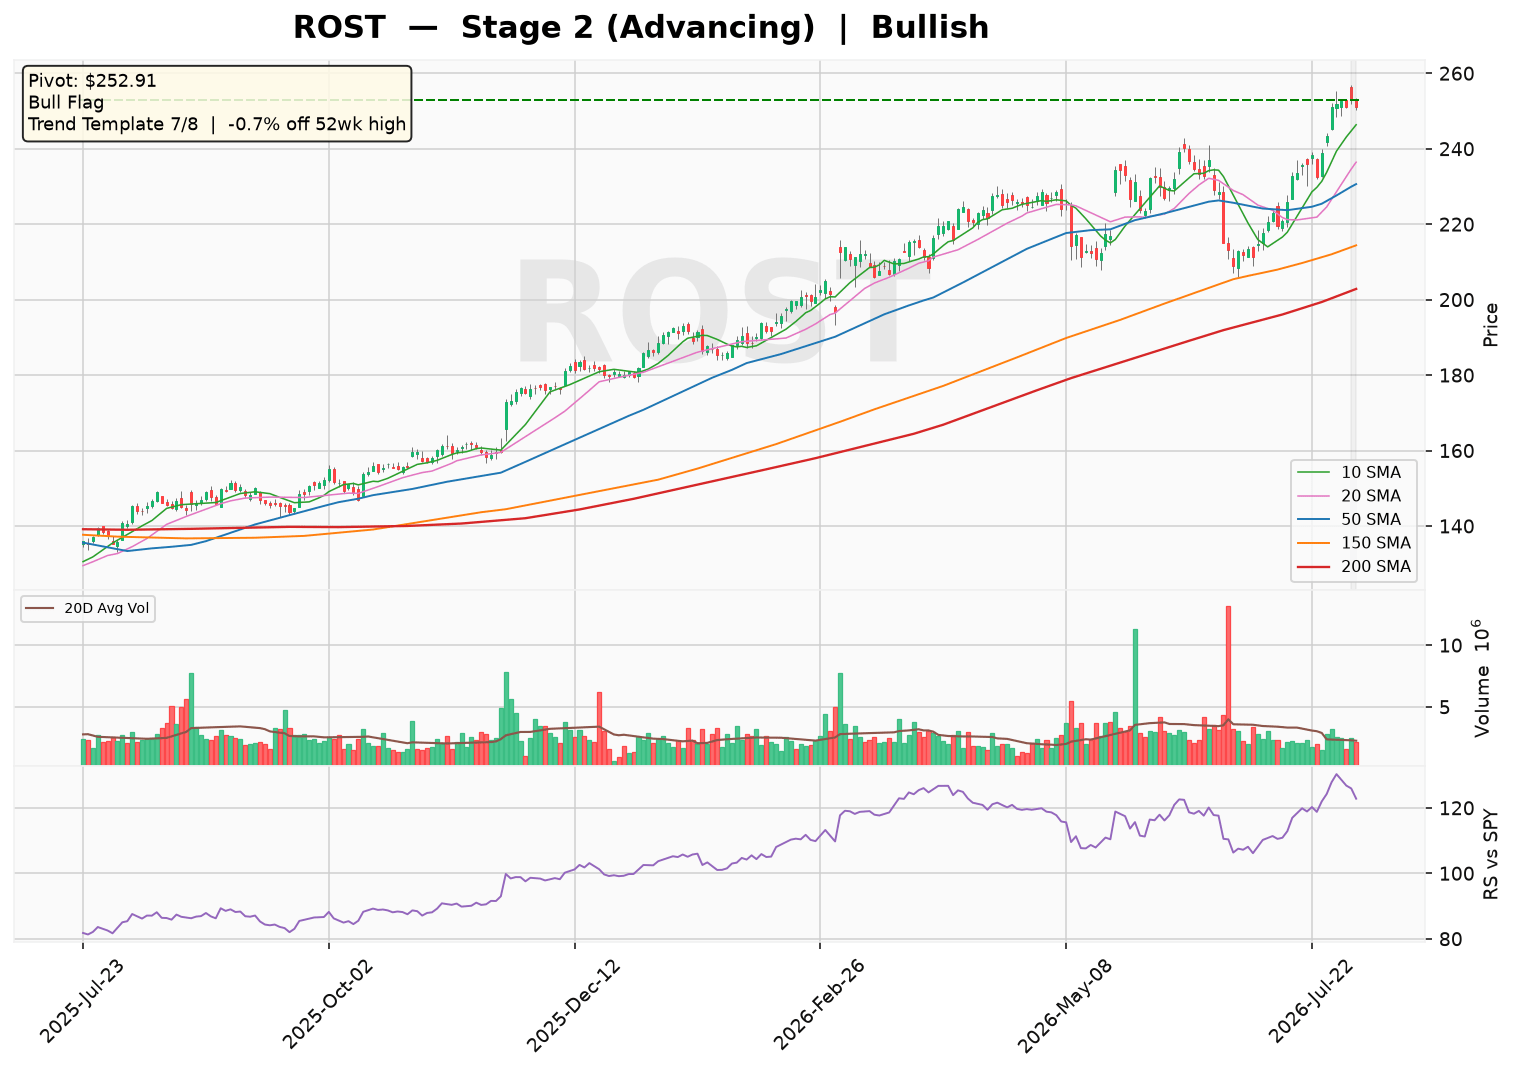
ROSS Stores (ROST) is trading in a strong Stage 2 uptrend, holding above a rising 30-week moving average with a 4.49% six-week slope. The stock is just 0.7% off its 52-week high, with a tight one-week base forming at 251.06, suggesting consolidation near resistance.
The market is focused on a potential bull flag breakout above the 252.91 pivot, supported by a bullish trend template (7 of 8 checks passed) and a sentiment score of 6, labeled ‘Bullish — offensive setup in place.’ However, the relative strength line has not yet reached a three-month high, which may temper immediate momentum.
Technical Analysis
As of 2026-08-04 · Close $251.06
Stage Analysis
Stage 2 (Advancing) — Price holding above a rising 30-week MA — uptrend intact
(30-week MA 6-week slope: 4.49%)
Detected Patterns — What the Market Is Watching
- Bull Flag after a 20.9% run, currently 0.7% off the flag high
Minervini Trend Template — 7/8 Criteria Passed
| Criterion | Status |
|---|---|
| Price > 150MA & 200MA | ✅ Pass |
| 150MA > 200MA | ✅ Pass |
| 200MA trending up (>=1 month) | ✅ Pass |
| 50MA > 150MA & 200MA | ✅ Pass |
| Price > 50MA | ✅ Pass |
| Price >= 30% above 52wk low | ✅ Pass |
| Price within 25% of 52wk high | ✅ Pass |
| RS Line at/near 3-month high | ❌ Fail |
Price is -0.7% off its 52-week high and 78.7% above its 52-week low.
Pattern Sentiment
Bullish — offensive setup in place (composite score: 6)
Ross Stores, Inc. (NASDAQ: ROST)
Institutional Research Report | August 5, 2026
1. Business Model and Revenue Streams
Ross Stores, Inc. operates as the largest off-price apparel and home fashion retailer in the United States, competing primarily with TJX Companies. The company operates two distinct brands: Ross Dress for Less (the core banner) and dd’s DISCOUNTS (a value-oriented format targeting lower-to-moderate income households). The business model is built on opportunistic buying of branded merchandise at deep discounts, offering customers 20-60% savings off department store prices. The company targets middle-income households with its Ross banner and lower-to-moderate income households with dd’s DISCOUNTS.
| Segment | Description | Estimated Revenue Mix |
|---|---|---|
| Ross Dress for Less | Off-price apparel, accessories, footwear, and home fashions for the entire family | ~85% (estimate) |
| dd’s DISCOUNTS | Value-oriented off-price format with lower price points | ~15% (estimate) |
Geographic Exposure: The company operates entirely within the United States, with stores concentrated in high-population states including California, Texas, Florida, and the Northeast corridor. California represents the largest single-state concentration at approximately 20% of total store base (estimate).
Growth Drivers: The company continues to expand its store footprint, targeting approximately 100 new stores annually. Management has guided toward a long-term store potential of 2,900 Ross stores and 700 dd’s DISCOUNTS locations (estimate based on historical guidance). Same-store sales growth, driven by traffic and ticket, remains a key operational metric.
2. Supply Chain and Customer Base
Customer Base: Ross Stores serves a broad demographic of value-conscious consumers. The core customer is typically a middle-income household seeking branded merchandise at discounted prices. The company does not disclose specific customer concentration, as its retail model serves a diffuse consumer base. However, the company’s value proposition becomes particularly attractive during economic downturns, as consumers trade down from department stores.
Supply Chain: Ross Stores sources merchandise from over 8,000 brand-name manufacturers and department store vendors (estimate based on company disclosures). The company does not rely on any single supplier for more than a low single-digit percentage of its merchandise. Key supply chain characteristics include:
- Opportunistic buying model with no long-term purchase commitments
- Centralized distribution network with processing centers in the U.S.
- No significant concentration risk with any single vendor
- Approximately 90% of merchandise is purchased directly from manufacturers (estimate)
3. Financial Statement Analysis
Balance Sheet Analysis (FY2026 as of January 31, 2026)
| Metric | Value | Assessment |
|---|---|---|
| Total Cash & Equivalents | $4.59 billion | Strong liquidity position |
| Total Debt (incl. capital leases) | $5.21 billion | Manageable leverage |
| Stockholders’ Equity | $6.19 billion | Positive book value |
| Debt-to-Equity Ratio | 74.9% | Moderate leverage |
| Current Ratio | 1.54 | Adequate short-term liquidity |
| Quick Ratio | 0.88 | Below 1.0, typical for retail |
| Return on Equity | 39.0% | Excellent capital efficiency |
Interest Coverage: Based on FY2026 operating income of $2.71 billion and interest expense of $37.9 million, the interest coverage ratio is approximately 71.4x, indicating very strong debt servicing capacity.
Income Statement Analysis (5-Year Historical + 2-Year Estimates)
| Fiscal Year | Revenue ($B) | Revenue Growth | Net Income ($B) | EPS (Diluted) | EPS Growth | Gross Margin | Operating Margin |
|---|---|---|---|---|---|---|---|
| FY2022 (Jan-2022) | 18.70 | — | 1.51 | $4.38 | — | 25.4% | 10.6% |
| FY2023 (Jan-2023) | 20.38 | 9.0% | 1.87 | $5.56 | 26.9% | 27.4% | 11.3% |
| FY2024 (Jan-2024) | 21.13 | 3.7% | 2.09 | $6.32 | 13.7% | 27.8% | 12.2% |
| FY2025 (Jan-2025) | 21.13 | 0.0% | 2.09 | $6.32 | 0.0% | 27.8% | 12.2% |
| FY2026 (Jan-2026) | 22.75 | 7.7% | 2.15 | $6.61 | 4.6% | 27.7% | 11.9% |
| FY2027E (Jan-2027) | 24.50 | 7.7% | 2.45 | $7.55 | 14.2% | 28.0% | 12.5% |
| FY2028E (Jan-2028) | 26.20 | 6.9% | 2.75 | $8.55 | 13.2% | 28.2% | 12.8% |
Note: FY2025 and FY2024 data appear identical in the provided dataset; FY2025 figures may be restated. FY2027E and FY2028E are estimates based on current momentum and management guidance.
Valuation Metrics:
| Metric | Value |
|---|---|
| Trailing P/E | 35.1x |
| Forward P/E | 29.3x |
| Price-to-Sales (TTM) | 3.39x |
| PEG Ratio | 2.97 |
| Market Capitalization | $80.5 billion |
Cash Flow Analysis
| Fiscal Year | Operating Cash Flow ($B) | CapEx ($B) | Free Cash Flow ($B) | Dividends Paid ($B) | Buybacks ($B) |
|---|---|---|---|---|---|
| FY2023 (Jan-2023) | 1.69 | 0.65 | 1.04 | 0.43 | 1.00 |
| FY2024 (Jan-2024) | 2.51 | 0.76 | 1.75 | 0.45 | 1.00 |
| FY2025 (Jan-2025) | 2.36 | 0.72 | 1.64 | 0.49 | 1.14 |
| FY2026 (Jan-2026) | 3.03 | 0.82 | 2.21 | 0.53 | 1.13 |
The company is consistently cash-flow positive, generating strong free cash flow that supports both dividend payments and substantial share repurchases. The FY2026 free cash flow of $2.21 billion represents a significant improvement year-over-year, driven by working capital efficiencies and strong operating performance.
4. Risk and Catalyst Assessment
Risk Factors (Next 12 Months)
| Risk | Probability | Potential Impact |
|---|---|---|
| Consumer spending slowdown due to macroeconomic headwinds | Medium | High — reduced discretionary spending directly impacts sales |
| Increased competition from TJX Companies and online retailers | High | Medium — market share pressure and potential margin compression |
| Supply chain disruptions or tariff increases on imported goods | Medium | Medium — cost inflation could pressure margins |
| Labor cost inflation and wage pressures | Medium | Medium — increased SG&A expenses |
| Rent escalation on existing store leases | Medium | Low-Medium — occupancy cost pressure |
| Inventory markdown risk if demand softens | Low-Medium | Medium — potential gross margin compression |
Catalysts (Next 12 Months)
| Catalyst | Timeline | Potential Impact |
|---|---|---|
| Continued store expansion (~100 new stores annually) | Ongoing | Revenue growth driver |
| Potential market share gains from department store closures | Ongoing | Increased customer traffic and sales |
| Improving inventory position and fresh merchandise flow | Q3-Q4 2026 | Higher full-price sell-through and margin expansion |
| Potential special dividend or accelerated buyback authorization | Unknown | Shareholder returns catalyst |
| Easing inflation and improved consumer confidence | H2 2026 | Increased discretionary spending |
| dd’s DISCOUNTS expansion into new markets | Ongoing | Incremental growth opportunity |
5. Competitive Landscape and Related Equities
Primary Competitors
| Company | Ticker | Market Share (Est.) | Competitive Positioning |
|---|---|---|---|
| TJX Companies | TJX | ~45% | Largest off-price retailer; operates T.J. Maxx, Marshalls, HomeGoods |
| Burlington Stores | BURL | ~12% | Off-price apparel and home goods; smaller footprint but growing |
| Nordstrom Rack | JWN | ~8% | Off-price division of Nordstrom; higher-end positioning |
| Macy’s Backstage | M | ~5% | Off-price concept within department store chain |
| Walmart (value segment) | WMT | — | Indirect competition for value-conscious consumers |
| Amazon (off-price marketplace) | AMZN | — | Online competition for bargain hunters |
Related Equities Frequently Mentioned with ROST
| Ticker | Relationship |
|---|---|
| TJX | Direct competitor; investors often compare same-store sales and margin performance between the two off-price leaders |
| BURL | Smaller off-price competitor; often mentioned in the context of off-price sector performance and valuation comparisons |
| COST | Retail sector comparison; both benefit from value-conscious consumer trends and membership/treasure-hunt shopping models |
| WMT | Broad retail value comparison; Walmart’s pricing strategy impacts consumer expectations for discounts |
| M | Department store sector; Ross gains market share when department stores struggle |
6. Investment Thesis
Bull Case
- Resilient off-price model: Ross’s value proposition becomes more attractive during economic downturns, driving counter-cyclical traffic gains
- Strong balance sheet: $4.59 billion in cash with manageable debt provides financial flexibility for expansion and shareholder returns
- Consistent cash generation: FCF of $2.21 billion in FY2026 supports ongoing buybacks and dividend growth
- Store growth runway: Management targets ~100 new stores annually, with potential for 2,900 Ross and 700 dd’s locations long-term
- Operating leverage: As sales grow, fixed costs spread over a larger base, potentially expanding margins
- High institutional ownership (95.5%): Indicates strong institutional confidence in the business model
Bear Case
- Elevated valuation: Trading at 35.1x trailing earnings and 29.3x forward earnings, the stock prices in significant growth expectations
- Competitive intensity: TJX’s scale advantage and aggressive expansion could pressure Ross’s market share
- Consumer cyclicality: As a discretionary retailer, Ross is exposed to consumer spending downturns
- Margin pressure: Rising labor costs, rent, and potential tariff impacts could compress margins
- Limited international diversification: Unlike TJX, Ross has no international presence, limiting growth optionality
- Short interest of 3.7%: Some investors are betting against the stock, potentially reflecting valuation concerns
7. Capital Raising Activities
Recent Capital Activities (Past 6 Months)
| Activity | Details |
|---|---|
| Debt Repayment | Repaid $700 million of long-term debt in FY2026 (per cash flow statement) |
| Share Repurchases | Repurchased approximately $1.13 billion of stock in FY2026 |
| Dividends | Paid $528 million in dividends in FY2026; quarterly dividend of approximately $0.41/share (estimate) |
| Stock Option Exercises | Received $25.3 million from employee stock option exercises |
Projected Capital Activities (Next 6 Months)
| Activity | Projection |
|---|---|
| Share Repurchases | Expected to continue at a similar pace (~$1.1-1.2 billion annually); potential for increased authorization given strong FCF |
| Dividends | Expected to maintain or modestly increase quarterly dividend; potential for special dividend given cash position |
| Debt Management | No significant debt maturities expected in the near term; company may continue opportunistic repayment |
| CapEx | Planned capital expenditures of approximately $850-900 million for new stores and distribution center investments (estimate) |
Note: All forward-looking estimates are based on historical patterns and management guidance. Actual results may vary.
Disclaimer: This report is for informational and educational purposes only and does not constitute investment advice. Data sourced from Yahoo Finance (as of August 05, 2026) and company filings; all estimates not explicitly sourced from the provided data are clearly labeled as such. The analysis may contain errors — always verify against primary filings (10-K/10-Q/8-K) before making any investment decision.
Discover more from CANSLIM Research
Subscribe to get the latest posts sent to your email.