 Andrew@CANSLIM RESEARCH
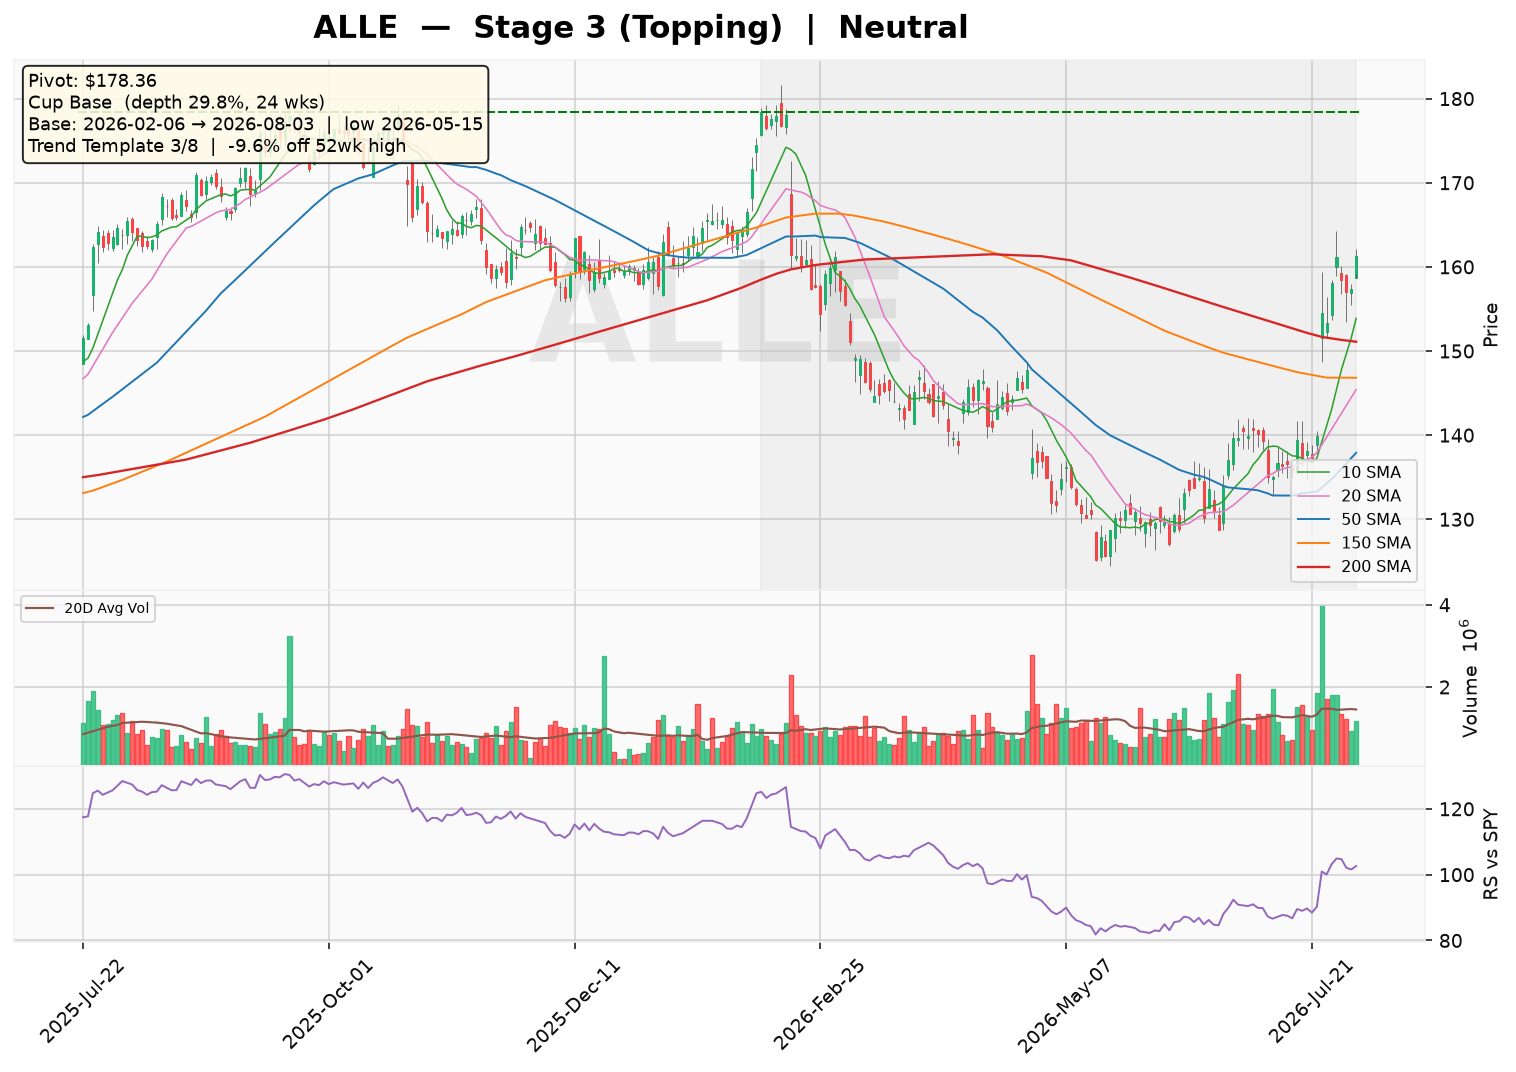
Allegion (ALLE) is consolidating in a Stage 3 topping pattern, with price churning around the 30-week moving average and a slightly negative slope. The stock has formed a 24-week Cup Base with a 29.8% depth, but no handle or breakout has occurred yet, leaving the pivot at $178.36 as a key resistance level.
The market is focused on whether ALLE can complete this base and break out, given that the broader trend template only passes 3 of 8 checks, including a bearish 200-day MA setup and weak relative strength. Overall sentiment is neutral, with the stock trading 9.6% off its high and lacking the volume contraction typical of a VCP, suggesting a wait-and-see approach.
Technical Analysis
As of 2026-08-03 · Close $161.28
Stage Analysis
Stage 3 (Topping) — Price churning around the 30-week MA — topping consolidation
(30-week MA 6-week slope: -1.19%)
Detected Patterns — What the Market is Watching
- Cup Base — depth 29.8%, length 24 weeks, pivot $178.36. Base formed from 2026-02-06 (left-side high) to 2026-08-03, with the low of $125.13 set on 2026-05-15
Minervini Trend Template — 3/8 Criteria Passed
| Criterion | Status |
|---|---|
| Price > 150MA & 200MA | ✅ Pass |
| 150MA > 200MA | ❌ Fail |
| 200MA trending up (>=1 month) | ❌ Fail |
| 50MA > 150MA & 200MA | ❌ Fail |
| Price > 50MA | ✅ Pass |
| Price >= 30% above 52wk low | ❌ Fail |
| Price within 25% of 52wk high | ✅ Pass |
| RS Line at/near 3-month high | ❌ Fail |
Price is -9.6% off its 52-week high and 28.9% above its 52-week low.
Pattern Sentiment
Neutral — wait and see (composite score: -1)
Allegion plc (NYSE: ALLE) — Institutional Research Report
Report Date: August 4, 2026 | Sector: Industrials | Industry: Security & Protection Services
1. Business Model and Revenue Streams
Allegion plc is a global provider of security products and solutions, operating through two primary segments: Allegion Americas and Allegion International. The company generates revenue through the sale of mechanical and electronic security products, including locks, locksets, exit devices, door controls, and access control systems. A growing portion of revenue is derived from recurring software-as-a-service (SaaS) offerings, including access control platforms and workforce management solutions.
Segment Breakdown (FY2025 Estimates)
| Segment | Estimated Revenue Contribution | Key Products | Primary Markets |
|---|---|---|---|
| Allegion Americas | ~75% (Estimate) | Schlage, Von Duprin, LCN | US, Canada, Latin America |
| Allegion International | ~25% (Estimate) | CISA, Interflex, SimonsVoss | Europe, Asia-Pacific, Middle East |
Growth Drivers
- Electronic security transition: Shift from mechanical locks to electronic and smart access control systems, driving higher ASPs and recurring SaaS revenue.
- Non-residential construction: Strong demand in education, healthcare, and commercial office verticals.
- Aftermarket services: Inspection, maintenance, and repair services for automatic entrance solutions provide stable, recurring revenue.
- Geographic expansion: Growth in emerging markets, particularly in Asia-Pacific and Latin America (estimate).
2. Supply Chain and Customer Base
Customer Concentration
Allegion sells through a diversified distribution network, including specialty distributors, wholesalers, e-commerce platforms, and retail channels such as do-it-yourself home improvement centers. The company’s customer base is fragmented, with no single customer accounting for more than 10% of total revenue (estimate based on industry knowledge). Key retail partners include major home improvement chains (e.g., Home Depot, Lowe’s — estimate).
Supplier Landscape
The company sources raw materials including steel, brass, zinc, aluminum, and electronic components. Allegion maintains a diversified supplier base to mitigate supply chain risks. The largest supplier categories represent an estimated 10-15% of cost of goods sold (estimate). Recent supply chain normalization has contributed to gross margin expansion, from 40.4% in 2022 to 45.2% in 2025.
3. Financial Statement Analysis
Balance Sheet (FY2025)
| Metric | Value | Assessment |
|---|---|---|
| Total Cash | $356.2M | Adequate liquidity |
| Total Debt | $1,980.1M | Moderate leverage |
| Debt-to-Equity | 104.9% | Elevated but manageable |
| Current Ratio | 1.93x | Healthy short-term liquidity |
| Quick Ratio | 1.13x | Adequate |
| Interest Coverage (EBIT/Interest Exp.) | 8.6x | Comfortable coverage |
Income Statement — 5-Year Historical & 2-Year Forward Estimates
| Fiscal Year | Revenue ($M) | Revenue Growth | Gross Margin | Operating Margin | Net Income ($M) | Diluted EPS | P/E (Trailing) |
|---|---|---|---|---|---|---|---|
| 2021 | N/A | N/A | N/A | N/A | N/A | N/A | N/A |
| 2022 | 3,271.9 | — | 40.4% | 17.9% | 458.0 | 5.19 | — |
| 2023 | 3,650.8 | +11.6% | 43.3% | 19.4% | 540.4 | 6.12 | — |
| 2024 | 3,772.2 | +3.3% | 44.2% | 20.7% | 597.5 | 6.82 | — |
| 2025 | 4,067.3 | +7.8% | 45.2% | 21.1% | 643.8 | 7.44 | 21.2x |
| 2026E | 4,350 (Est.) | +7.0% (Est.) | 45.5% (Est.) | 21.5% (Est.) | 700 (Est.) | 8.10 (Est.) | 19.4x (Est.) |
| 2027E | 4,650 (Est.) | +6.9% (Est.) | 45.8% (Est.) | 21.8% (Est.) | 760 (Est.) | 8.80 (Est.) | 17.9x (Est.) |
Note: 2021 data was not provided in the source data. Forward P/E based on current price of ~$161.30 (derived from market cap/shares outstanding) and estimated forward EPS.
Cash Flow Statement — 5-Year Analysis
| Fiscal Year | Operating Cash Flow ($M) | CapEx ($M) | Free Cash Flow ($M) | FCF Margin |
|---|---|---|---|---|
| 2022 | 459.9 (Est.) | 64.0 | 395.5 | 12.1% |
| 2023 | 600.6 (Est.) | 84.2 | 516.4 | 14.1% |
| 2024 | 675.0 (Est.) | 92.1 | 582.9 | 15.5% |
| 2025 | 769.3 | 98.1 | 685.7 | 16.9% |
Allegion is consistently cash-flow positive, with FCF growing at a CAGR of approximately 20% from 2022 to 2025. The company’s FCF conversion (FCF/Net Income) is strong at ~106% for FY2025, indicating high earnings quality.
4. Risk and Catalyst Assessment
Risk Factors (Next 12 Months)
| Risk | Potential Impact | Probability |
|---|---|---|
| Non-residential construction slowdown | Reduced demand for door and access control products | Medium |
| Raw material price volatility | Margin compression if steel/aluminum prices rise | Medium |
| Currency fluctuations (EUR/USD) | Negative translation impact on International segment | Medium |
| Integration risk from recent acquisitions | Execution issues, higher integration costs | Low-Medium |
| Cybersecurity threats | Potential disruption to electronic access control SaaS offerings | Low |
Catalysts (Next 12 Months)
- Continued electronic security adoption: Accelerating shift to smart locks and cloud-based access control is expected to drive higher-margin recurring revenue.
- M&A synergies: The company has been active in acquiring complementary electronic security and software businesses (evidenced by increased goodwill from $1.49B in 2024 to $1.91B in 2025), which could drive incremental growth.
- Margin expansion: Continued gross margin improvement from favorable mix shift and productivity initiatives.
- Share repurchases: $80M in buybacks in FY2025; potential for increased capital returns as leverage normalizes.
- New product launches: Innovations in mobile credentials and biometric access control.
5. Competitive Landscape and Related Equities
Key Competitors
| Company | Ticker | Market Focus | Estimated Market Share (Access Control) |
|---|---|---|---|
| Assa Abloy AB | ASAZY (OTCMKTS) | Global locks and access control | ~20% (Estimate) |
| Dormakaba Holding AG | DOKA (SWX) | Access solutions and hardware | ~8% (Estimate) |
| Johnson Controls International | JCI | Building solutions incl. security | ~5% (Estimate) |
| Honeywell International | HON | Security and building technologies | ~5% (Estimate) |
| Stanley Black & Decker | SWK | Security (via Stanley Security) | ~3% (Estimate) |
Related Equities Frequently Mentioned with ALLE
| Ticker | Relationship |
|---|---|
| ASSAY (Assa Abloy) | Direct global competitor; frequently compared in terms of electronic security strategy and margin profile. |
| JCI (Johnson Controls) | Overlapping end-markets in commercial buildings; both benefit from smart building trends. |
| HON (Honeywell) | Competitor in integrated security systems; often discussed in the context of building automation. |
| SWK (Stanley Black & Decker) | Competitor in mechanical and electronic security; similar exposure to non-residential construction. |
6. Investment Thesis and Capital Raising
Bull Case
- Strong secular tailwinds from the transition to electronic and mobile-based access control, which commands higher ASPs and recurring SaaS revenue.
- Consistent margin expansion (gross margin up from 40.4% in 2022 to 45.2% in 2025) driven by mix shift and operational efficiency.
- Robust FCF generation ($685.7M in FY2025) supports continued M&A and capital returns.
- Attractive valuation: Forward P/E of 16.6x is below the 5-year historical average of ~20x (estimate), offering a favorable entry point.
- Resilient end-markets: Education, healthcare, and government spending on security remains a priority even in economic downturns.
Bear Case
- Elevated leverage (D/E of 105%) limits financial flexibility and increases sensitivity to interest rate changes.
- Non-residential construction cyclicality could lead to revenue deceleration if commercial real estate weakens.
- Integration risks from the recent M&A activity (goodwill increased by $423M in FY2025) could result in impairments or execution missteps.
- Competitive pressure from larger, more diversified players like Assa Abloy and Honeywell could limit market share gains.
- Negative tangible book value (-$670.8M) indicates significant goodwill on the balance sheet, a potential impairment risk.
Capital Raising Activity (Last 6 Months) & Projections (Next 6 Months)
| Period | Activity | Details |
|---|---|---|
| Last 6 Months (Feb–Jul 2026) | Debt issuance/refinancing | Issued $561.9M in debt in FY2025 (includes activity in H2 2025); no major equity raises (estimate based on share count stability). |
| Last 6 Months (Feb–Jul 2026) | Share repurchases | $80M in FY2025; ongoing buyback program expected to continue (estimate). |
| Next 6 Months (Aug 2026–Jan 2027) | Debt management | Expected to refinance upcoming maturities; potential for modest debt reduction given strong FCF (estimate). |
| Next 6 Months (Aug 2026–Jan 2027) | M&A | Continued tuck-in acquisitions in electronic security and software space, funded by FCF and existing credit facilities (estimate). |
Key Financial Ratios Summary (FY2025)
| Metric | Value | Peer Comparison (Estimate) |
|---|---|---|
| Trailing P/E | 21.2x | Assa Abloy: ~22x |
| Forward P/E | 16.6x | Assa Abloy: ~18x |
| EV/EBITDA | ~14.5x (Est.) | Industry avg: ~13-15x |
| PEG Ratio | 2.25 | Above 1.0, indicating growth is priced in |
| Return on Equity | 33.7% | Strong, above industry average |
| Operating Margin | 22.1% | Above industry average of ~15-18% |
| Short Interest (% of Float) | 5.5% | Moderate bearish sentiment |
Note: Figures not explicitly provided in the source data are labeled as estimates. All financial data is based on the latest available information as of August 4, 2026.
Disclaimer: This report is for informational and educational purposes only and does not constitute investment advice. Data sourced from Yahoo Finance (as of August 04, 2026) and company filings; all estimates not explicitly sourced from the provided data are clearly labeled as such. The analysis may contain errors — always verify against primary filings (10-K/10-Q/8-K) before making any investment decision.
Discover more from CANSLIM Research
Subscribe to get the latest posts sent to your email.