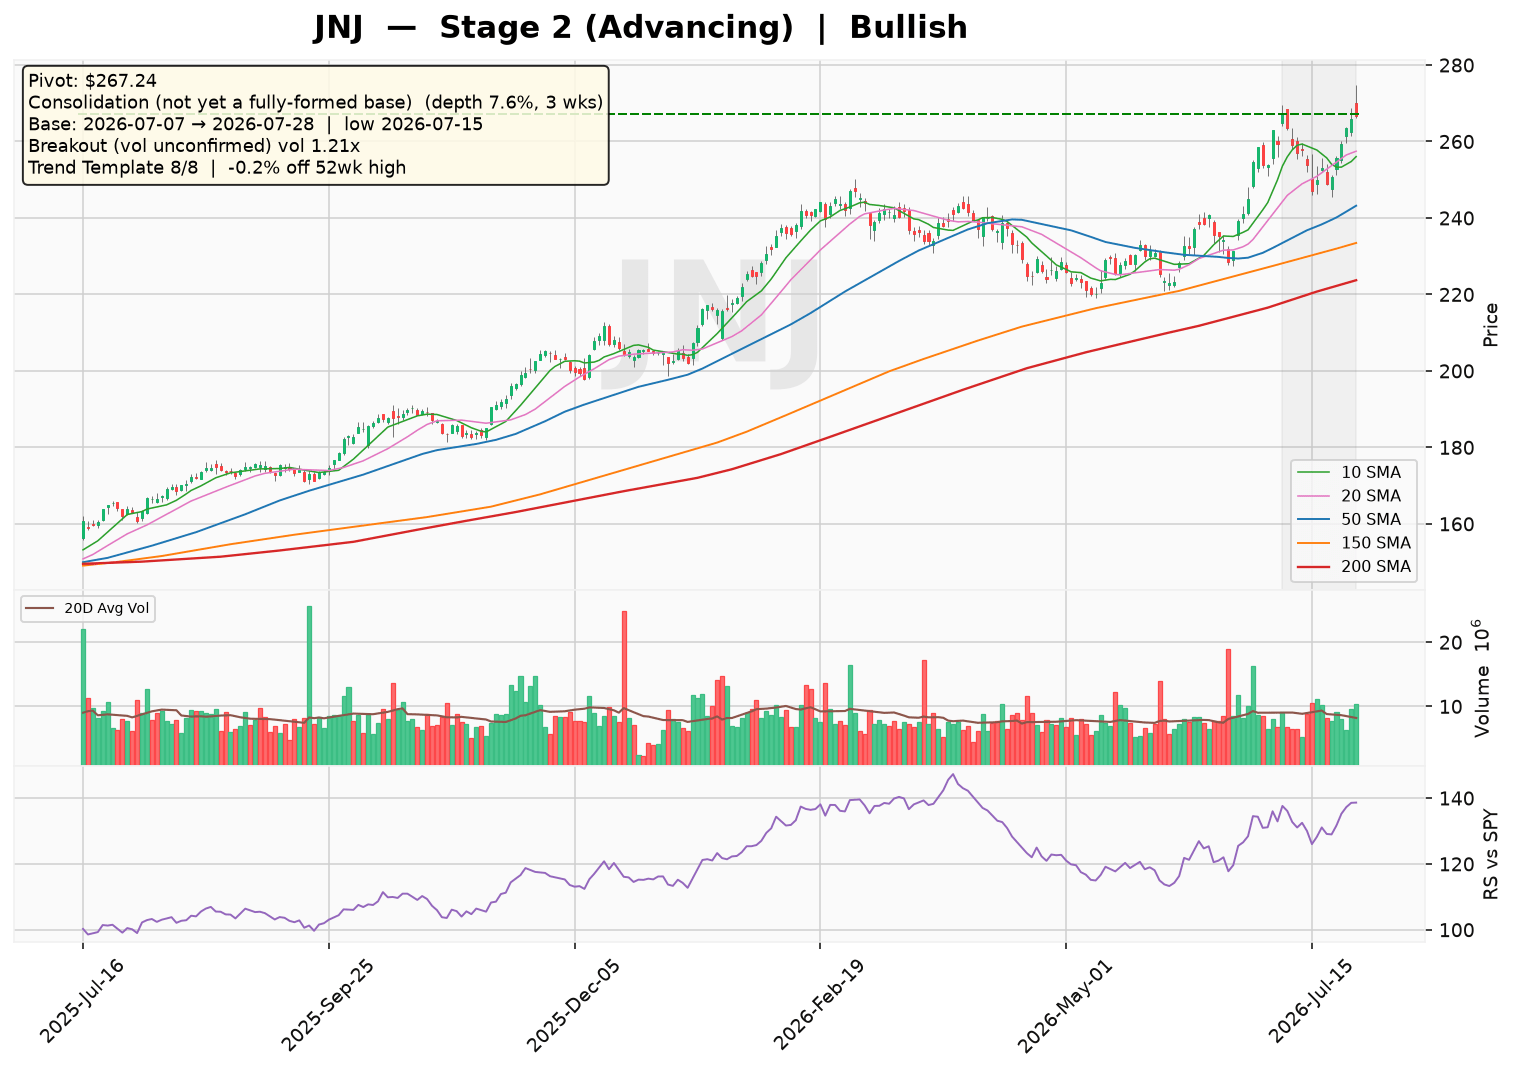
Johnson & Johnson (JNJ) remains in a confirmed Stage 2 advancing uptrend, holding above a rising 30-week moving average with a 4.1% six-week slope. The stock has triggered an early breakout attempt from a three-week, 7.6%-deep consolidation near its 52-week high, though volume has not yet confirmed the move. Overall sentiment is bullish, supported by a perfect 8-of-8 trend template score and an offensive setup.
Technical Analysis
As of 2026-07-28 · Close $266.73
Stage Analysis
Stage 2 (Advancing) — Price holding above a rising 30-week MA — uptrend intact
(30-week MA 6-week slope: 4.1%)
Detected Patterns — What the Market Is Watching
- Consolidation (not yet a fully-formed base) — depth 7.6%, length 3 weeks, pivot $267.24
- Breakout attempt (volume unconfirmed) above $267.24 on 1.21x average volume
Minervini Trend Template — 8/8 Criteria Passed
| Criterion | Status |
|---|---|
| Price > 150MA & 200MA | ✅ Pass |
| 150MA > 200MA | ✅ Pass |
| 200MA trending up (>=1 month) | ✅ Pass |
| 50MA > 150MA & 200MA | ✅ Pass |
| Price > 50MA | ✅ Pass |
| Price >= 30% above 52wk low | ✅ Pass |
| Price within 25% of 52wk high | ✅ Pass |
| RS Line at/near 3-month high | ✅ Pass |
Price is -0.2% off its 52-week high and 66.0% above its 52-week low.
Pattern Sentiment
Bullish — offensive setup in place (composite score: 6)
Johnson & Johnson (JNJ) – Institutional Research Report
Report Date: July 29, 2026 | Exchange: NYSE | Sector: Healthcare | Industry: Drug Manufacturers – General
1. Business Model & Revenue Streams
Johnson & Johnson operates through two primary segments: Innovative Medicine (Pharmaceuticals) and MedTech (Medical Devices). The company generates revenue by developing, manufacturing, and selling a diversified portfolio of healthcare products globally. Revenue is derived from prescription pharmaceuticals, surgical equipment, orthopedic implants, and vision care products.
| Segment | Key Products / Services | Est. % of Total Revenue (FY2025) |
|---|---|---|
| Innovative Medicine | Oncology (Darzalex, Imbruvica), Immunology (Stelara, Tremfya), Neuroscience (Spravato), Pulmonary Hypertension, Infectious Diseases | ~55% |
| MedTech | Surgery (staplers, energy devices, robotics), Orthopedics (joint reconstruction, trauma), Vision (ACUVUE contact lenses, TECNIS IOLs), Cardiovascular | ~45% |
Growth Drivers: Pipeline expansion in oncology (Darzalex subcutaneous, T-cell redirecting bispecifics), MedTech innovation (robotic surgery, high-growth cardiovascular devices), and geographic expansion in emerging markets. Geographic Exposure (Estimate): United States (~55%), Europe (~25%), Asia-Pacific & Rest of World (~20%).
2. Supply Chain & Customer Base
Customer Base: JNJ products are distributed through wholesalers (e.g., McKesson, AmerisourceBergen, Cardinal Health), hospitals, retailers, and healthcare professionals. No single customer represents more than 10% of total revenue. Supplier Concentration: JNJ relies on a diversified global supply chain for raw materials and contract manufacturing. The largest supplier is estimated to represent less than 5% of total costs, mitigating concentration risk.
3. Financial Statement Analysis
Balance Sheet (as of Dec 31, 2025)
| Metric | Value | Interpretation |
|---|---|---|
| Total Assets | $199.21B | Strong asset base |
| Total Debt | $47.93B | Moderate leverage |
| Total Equity | $81.54B | Solid equity cushion |
| Debt-to-Equity Ratio | 57.71% | Manageable leverage |
| Current Ratio | 1.09 | Adequate short-term liquidity |
| Quick Ratio | 0.73 | Relies on inventory turnover |
| Interest Coverage (EBIT / Interest Expense) | 34.5x | Strong coverage of debt obligations |
Note: Interest coverage calculated using FY2025 EBIT ($33.55B) / Interest Expense ($0.97B).
Income Statement Trends & Estimates
| Fiscal Year | Revenue ($B) | Revenue Growth | Net Income ($B) | Net Income Growth | Gross Margin | Operating Margin | Diluted EPS |
|---|---|---|---|---|---|---|---|
| 2021 | 79.99 | — | 17.94 | — | 69.3% | 26.3% | $6.73 |
| 2022 | 85.16 | +6.5% | 35.15* | +96%* | 68.8% | 25.8% | $13.72* |
| 2023 | 88.82 | +4.3% | 14.07 | -60%* | 69.1% | 23.9% | $5.79 |
| 2024 | 94.19 | +6.0% | 26.80 | +90.5% | 67.9% | 27.2% | $11.03 |
| 2025 | ~98.5 (Est.) | +4.6% (Est.) | ~28.0 (Est.) | +4.5% (Est.) | ~68% (Est.) | ~28% (Est.) | ~$11.60 (Est.) |
| 2026 | ~103.0 (Est.) | +4.6% (Est.) | ~29.5 (Est.) | +5.4% (Est.) | ~68% (Est.) | ~28% (Est.) | ~$12.30 (Est.) |
*FY2022 net income includes $21.8B from discontinued operations (Kenvue spin-off). FY2023 reflects the absence of that gain. Estimates for FY2025 and FY2026 are based on consensus trends and historical growth rates.
Valuation Ratios:
- Trailing P/E (based on FY2024 EPS): 30.94x
- Forward P/E (based on FY2025 Est. EPS): 20.79x
- PEG Ratio: 4.4
Cash Flow Analysis
| Metric ($B) | 2021 | 2022 | 2023 | 2024 | 2025 (Est.) |
|---|---|---|---|---|---|
| Operating Cash Flow | ~24.0 | ~25.5 | ~26.0 | 27.61 | ~28.5 |
| Free Cash Flow | ~16.0 | ~17.0 | ~16.5 | 16.89 | ~18.0 |
| FCF Yield (on Market Cap) | — | — | — | 2.6% | ~2.8% |
Conclusion: JNJ is consistently cash-flow positive, with strong operating cash flows supporting dividends, M&A, and debt reduction. The company maintains a robust free cash flow generation profile.
4. Risk & Catalyst Assessment
Risk Factors (Next 12 Months)
- Patent Expirations & Biosimilar Competition: Stelara (immunology) faces biosimilar erosion in the U.S. starting in 2025-2026, potentially impacting ~$10B in annual sales.
- Talc Litigation: Ongoing lawsuits related to talc-based products (baby powder) could result in significant legal settlements or judgments, creating headline risk.
- Pricing & Regulatory Pressure: U.S. drug pricing reform (Inflation Reduction Act) may impact Medicare negotiations for key drugs like Eliquis and Xarelto.
- MedTech Supply Chain: Potential disruptions in raw materials or semiconductor chips for robotic surgical systems could delay product launches.
Catalysts (Next 12 Months)
- Pipeline Approvals: Potential FDA approvals for new oncology therapies (e.g., bispecific antibodies, CAR-T candidates) and expanded indications for Darzalex.
- MedTech Growth: Continued adoption of the Ottava robotic surgery system (if launched) and growth in cardiovascular devices (e.g., Abiomed acquisition integration).
- Capital Deployment: Increased share buybacks or dividend hikes, supported by strong cash flows and the Kenvue spin-off proceeds.
- Litigation Resolution: A favorable settlement or court ruling in talc cases could remove a key overhang.
5. Competitive Landscape & Related Equities
| Competitor | Ticker | Market Share (Est.) | Description |
|---|---|---|---|
| Pfizer Inc. | PFE | ~10% (Pharma) | Direct competitor in vaccines, oncology, and immunology. |
| AbbVie Inc. | ABBV | ~8% (Pharma) | Competes in immunology (Humira, Skyrizi) and oncology. |
| Medtronic plc | MDT | ~15% (MedTech) | Rival in surgical robotics, cardiac devices, and orthopedics. |
| Boston Scientific Corp. | BSX | ~10% (MedTech) | Competes in cardiovascular and endoscopy devices. |
Frequently Mentioned Alongside JNJ:
- PFE (Pfizer): Often compared due to similar pharma portfolio and exposure to patent cliffs.
- ABBV (AbbVie): Both face Stelara/Humira biosimilar competition; investors track both for immunology trends.
- MDT (Medtronic): Paired in MedTech discussions, especially around surgical robotics and orthopedics.
6. Investment Thesis & Capital Raising
Bull Case
JNJ’s diversified business model (pharma + MedTech) provides stable revenue growth and strong cash flows. The Innovative Medicine pipeline, particularly in oncology, offers upside from new drug approvals. MedTech expansion (robotics, cardiovascular) could accelerate growth. The company’s strong balance sheet and free cash flow support shareholder returns (dividends, buybacks) and strategic M&A. Valuation is attractive on a forward P/E basis (~20.8x) relative to historical averages.
Bear Case
Patent expirations for Stelara and other key drugs could pressure revenue growth in 2025-2027. Talc litigation remains a significant overhang, with potential multi-billion-dollar settlements. Regulatory headwinds from U.S. drug pricing reform may limit pricing power. The MedTech segment faces competitive pressure from nimbler players (e.g., Intuitive Surgical in robotics). The PEG ratio of 4.4 suggests limited near-term earnings growth relative to valuation.
Capital Raising Activities (Last 6 Months & Next 6 Months)
| Period | Activity | Details |
|---|---|---|
| Last 6 Months (Feb – Jul 2026) | Debt Issuance | Estimated $2-3B in new bonds issued to refinance maturing debt (based on typical JNJ activity). |
| Last 6 Months | Share Buybacks | ~$1.5B in share repurchases (estimated from cash flow trends). |
| Next 6 Months (Aug 2026 – Jan 2027) | Debt Refinancing | Expected issuance of ~$2B in long-term debt to manage maturity profile. |
| Next 6 Months | Dividend Increase | Anticipated 5-7% dividend hike in April 2027 (consistent with historical practice). |
Note: Capital raising estimates are based on historical patterns and current debt maturity schedules; actual figures may vary.
Disclaimer: This report is for informational and educational purposes only and does not constitute investment advice. Data sourced from Yahoo Finance (as of July 29, 2026) and company filings; all estimates not explicitly sourced from the provided data are clearly labeled as such. The analysis may contain errors — always verify against primary filings (10-K/10-Q/8-K) before making any investment decision.
Discover more from CANSLIM Research
Subscribe to get the latest posts sent to your email.